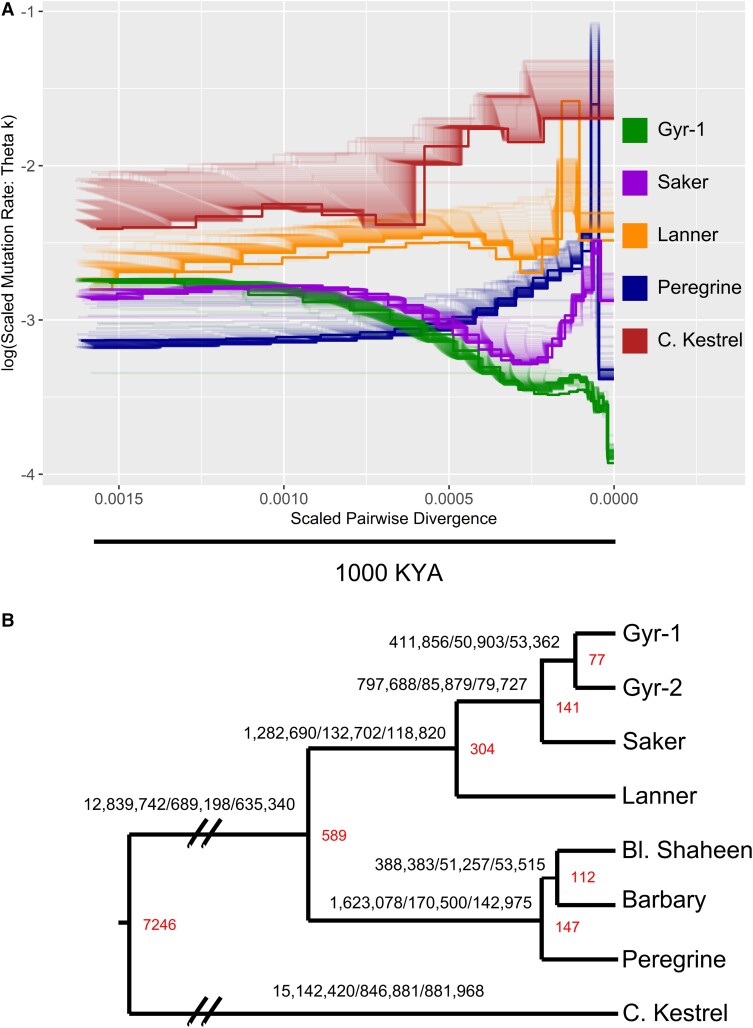
Fig. 4.
Demographic and evolutionary history of the eight falcon genomes. (A) PSMC: time is indicated on the X-axis and is represented by scaled-pairwise divergence, with higher values indicating more ancestral time points scaled to 1000 kya based on the average divergence calculated across all species. Population size is indicated on the Y-axis as log10(scaled-population-mutation rate), with higher values indicating larger effective population sizes. (B) Maximum-likelihood tree built using all variable SNV sites detected from alignment to the kestrel genome. The tree was dated based on divergence between the kestrels and large falcons and is shown on the same timescale as the PSMC with a truncation (//) on the long branches between the common kestrel and other falcons. Node labels (red) indicate divergence times in kya. Branch labels denote the branch-specific number of unique shared small variants <50 bp: SNVs/deletions/insertions.

