
FIGURE 2.
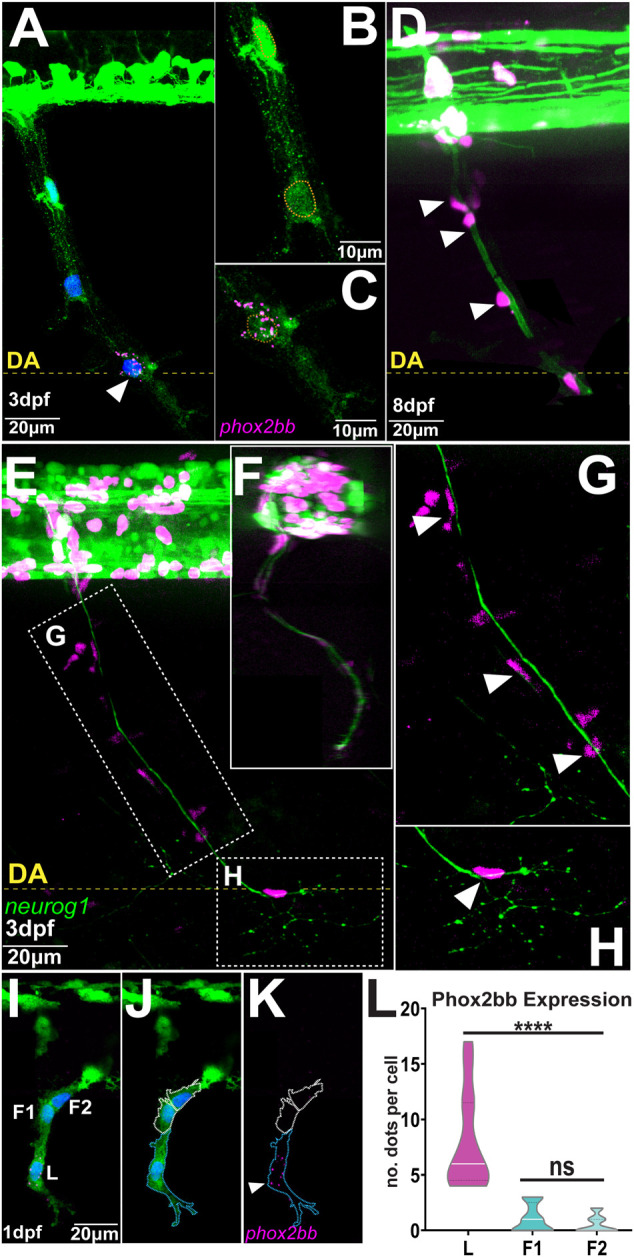
Phox2bb is predominantly expressed in leader cells (A–C) phox2bb expression at 3dpf (B) Enlargements of follower and (C) leader cells. Sox10 in green, phox2bb in magenta and nuclei in blue in panel A and highlighted with orange dotted lines in B-C (D) Confocal image of Sox10:mG embryo at 8dpf. White arrowheads indicate TNC cells showing Schwann cell morphology (E–H) Confocal images of Sox10:mG; neurogenin1:GFP at 3dpf showing sensory neuron axon extension from DRG to SCG lateral view in (E) and transversal section in (F) (G) Enlargement showing TNC followers localising around the axon in position of Schwann cells indicated by white arrowheads and (H) Enlargement showing single leader cell in the position of SCG (I–K) Confocal image of Sox10:GFP embryo at 1dpf showing expression of phox2bb in leader cell. L: Leader, F1 and F2: first and second followers. White arrowheads indicate leader. Blue and white dotted lines mark the outlines of leader and follower cells respectively (L) Quantification of phox2bb expression (n = 14 chains; Welch’s t test, L vs. F1 and F2 p < 0.0001, F1 vs. F2 p = 0.2566). Anterior to the left, dorsal top. DA: Dorsal Aorta.