FIGURE 4.
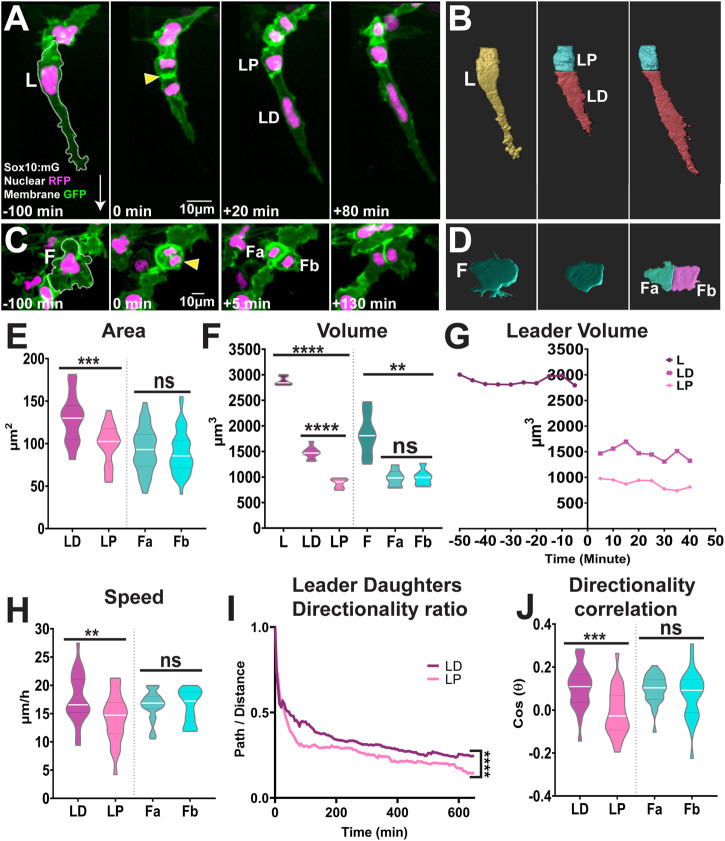
Leaders TNC divide asymmetrically while followers divide symmetrically (A,B) Confocal images of Sox10:mG (A) and 3D rendering (B) of leader asymmetric division into distal and proximal daughters. L: Leader, LD: Leader Distal, LP: Leader Proximal; white arrow indicates direction of migration and yellow arrowhead points to the dividing cell (C,D) Confocal images of Sox10:mG (C) and 3D rendering (D) of follower symmetric division. F: Follower, Fa and Fb Follower’s daughters (E) Quantification of cell area of leaders’ and followers’ daughters quantified immediately after division (n = 25 for leaders and n = 44 for followers; Unpaired t test, p = 0.0001 for LD vs. LP and p = 0.5852 for Fa vs. Fb) (F) Quantification of cell volume of leaders, followers and their daughters after division (n = 10 divisions for leaders and n = 10 divisions for followers; Brown-Forsythe and Welch ANOVA tests, p < 0.0001 for L vs. LD and LP, p < 0.0001 for LD vs. LP, p = 0.0012 for F vs. Fa and Fb, p > 0.9999 for Fa vs. Fb) (G) Cell volume over time of a representative leader before and after division (H) Quantification of speed of movement of leaders’ and followers’ daughters (n = 25 for leaders and n = 44 for followers; Unpaired t test, p = 0.0072 for LD vs. LP, p = 0.8690 for Fa vs. Fb) (I) Directionality ratio of leaders’ daughters (n = 25 divisions; Simple linear regression, p < 0.0001 for LD vs. LP) (J) Directionality correlation of leaders’ and followers’ daughters (n = 25 for leaders and n = 44 for followers; Welch’s t test, p = 0.0004 for LD vs. LP, p = 0.2798 for Fa vs. Fb).

