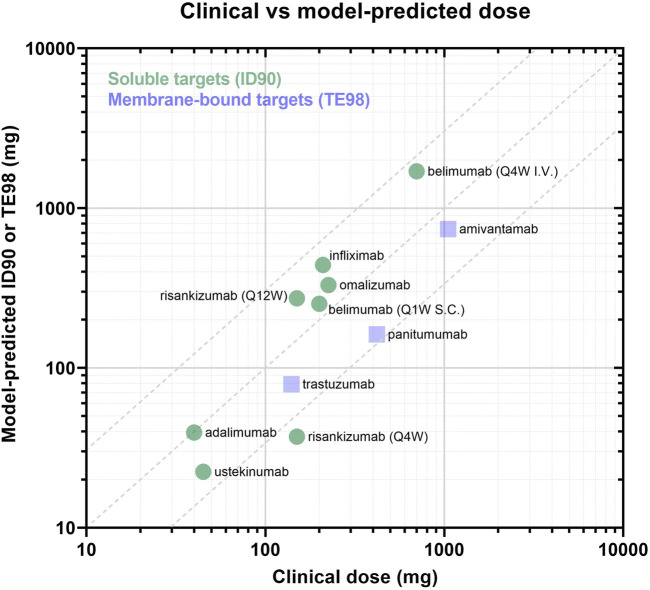
FIGURE 5.
Panel of model-predicted vs. clinically approved dose. Drugs with soluble targets are displayed as green circles and are evaluated based on ID90 (i.e., inhibition of baseline ligand:receptor complex). Drugs with membrane-bound targets are displayed in purple squares and are evaluated by TE98 (i.e., percent of target bound by drug). Dotted lines define the region where model-predicted effective doses fall within 3-fold of the clinically-approved doses.

