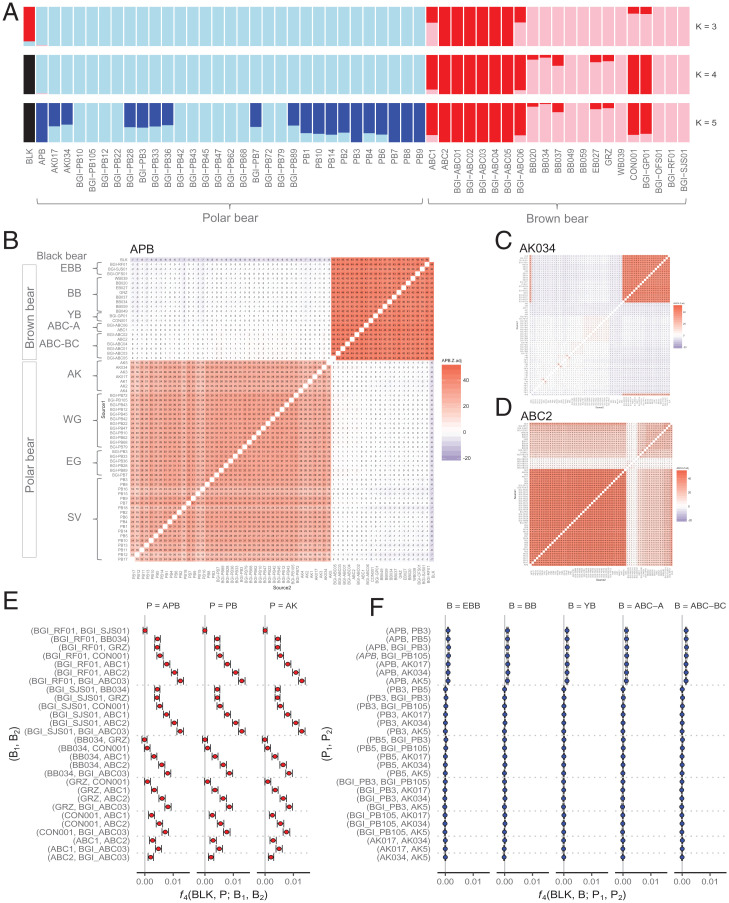
Fig. 3.
(A) ADMIXTURE analysis of brown bear, polar bear, and American black bear genomes with coverage >8× (ancestral population clusters, K = 3 to 5, is shown). (B) f3 statistics results (adjusted Z scores) showing target population APB, (C) AK034 (Alaskan polar bear), and (D) ABC2 (Chichagof brown bear). The bear group acronyms follow the descriptions in Fig. 1. f4-statistics showing f4 values and their 95% confidence intervals of (E) f4(BLK, X; B1, B2) and (F) f4(BLK, X; P1, P2).

