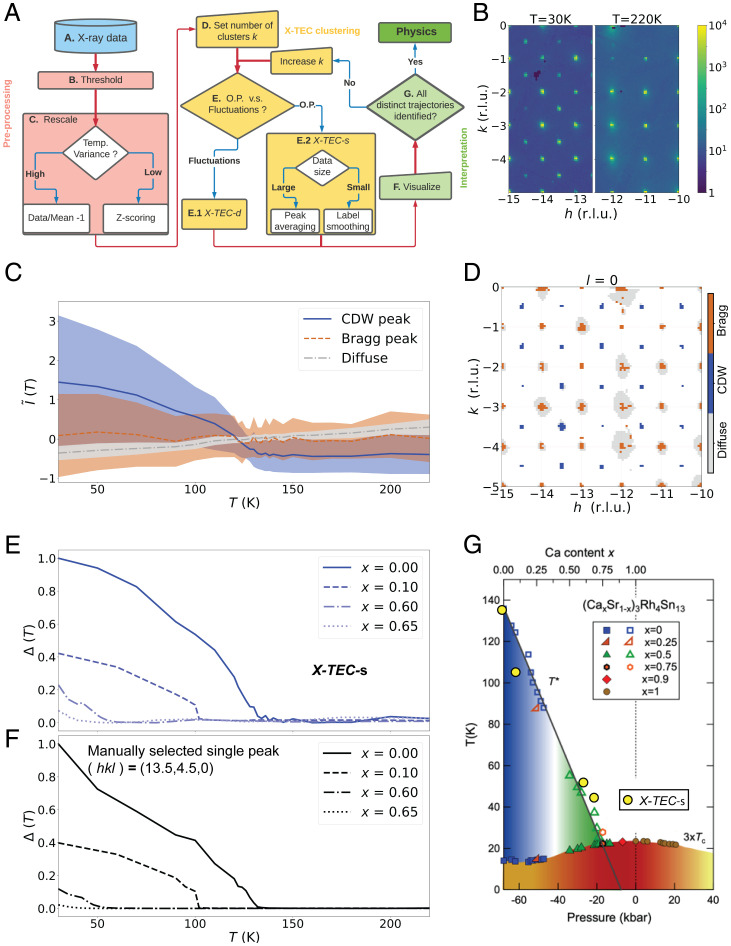
Fig. 2.
Illustration and benchmarking of X-TEC. (A) A flowchart describing the execution of X-TEC. The steps are described in the Implementation of X-TEC section and further detailed in SI Appendix, section 1. (B) Raw XRD image showing a slice of the reciprocal space in the plane, at T = 30 K (Left) and T = 220 K (Right). The CDW superlattice peaks are visible at T = 30 K and are absent at T = 220 K. (C and D) X-TECs results of the Sr3Rh4Sn13 XRD data with spanning the reciprocal space where reciprocal lattice units (r.l.u.). The clustering assignments are color-coded as blue, brown, and gray. In C, the lines represent cluster means, and the shaded region shows 1 SD, interpolated between 24 temperature points of measurement. D shows the pixels at in the plane that passed the thresholding (SI Appendix, section 1B), colored according to their cluster assignments. X-TEC correctly identifies the blue clusters with the CDW super lattice peaks, brown clusters with Bragg peaks, and gray clusters with diffuse scattering. The blue cluster mean (solid line) in C represents the rescaled intensity trajectories of all CDW peaks in the data. (E) An order parameter like quantity is estimated from the CDW (blue) cluster and is shown for four samples at different values of Ca doping x. The is estimated from the cluster means by subtracting the minimum from each cluster mean and appropriate normalization. (F) extracted from a manually selected CDW peak at for the four Ca doping x shows a qualitatively similar trajectory to that of X-TEC in E. (G) The critical temperatures estimated from the X-TEC extracted (yellow filled circles) overlaid onto the known phase diagram from ref. 26 based on phase boundaries from thermodynamic measurements and transport.

