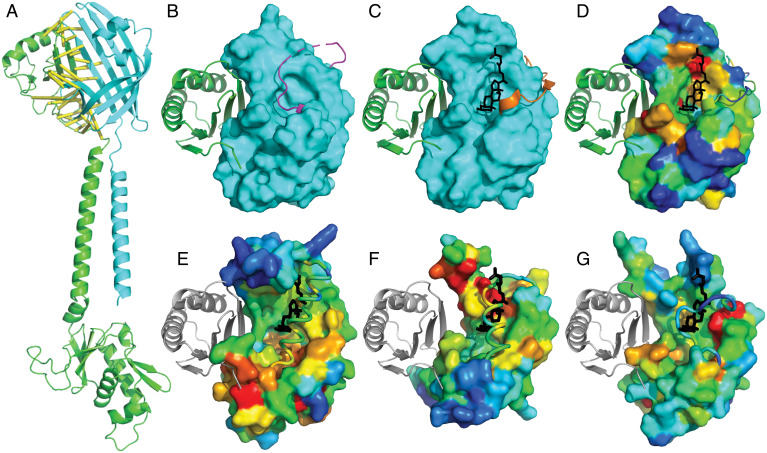
Fig. 4.
Functional implications of VtrA/VtrC superfamily fold prediction. (A) GrvA (green cartoon) complex model with FidL (cyan cartoon). Confidently predicted residue–residue contacts are connected by yellow bars (residue–residue distance in structure model ≤ 8 Å and predicted aligned error ≤ 4 Å). (B) VtrA (green cartoon) experimental structure bound to ligand-free VtrC (cyan surface), with a mobile loop (magenta) covering the lipid binding site. (C) VtrA/VtrC experimental structure bound to TDC (black stick) displaces the mobile loop (orange). (D) VtrC surface is colored in rainbow by family-based residue conservation from low (blue) to high (red). (E) ToxS, (F) YP3282, and (G) BprQ structure models (rainbow conservation) are superimposed with VtrC to highlight relative positions of VtrA (gray cartoon) and TDC (black stick). The corresponding mobile loops (cartoon tubes) cover the potential lipid binding sites as in the apo VtrA/VtrC structure.

