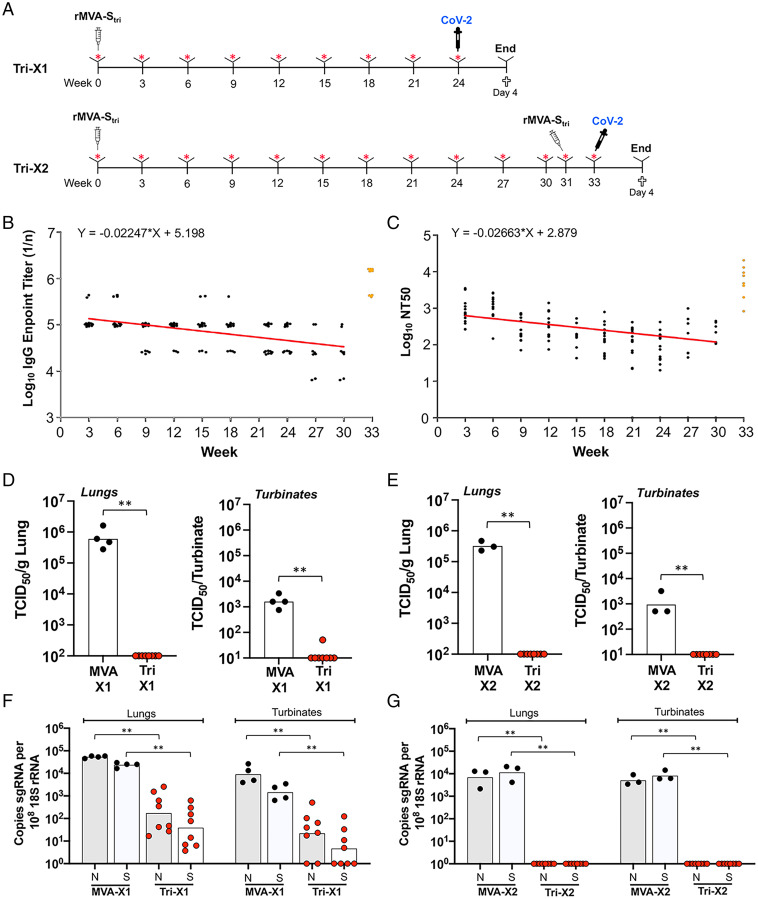
Fig. 2.
Duration of immune response and protection following IM vaccination. (A) K18-hACE2 mice were vaccinated once (Tri-X1, n = 8) or twice (Tri-X2, n = 8) with 2 × 10⁷ PFU of rMVA-Stri or MVA as a control once (n = 4) or twice (n = 3) and bled at 3-wk intervals. The mice were challenged IN with 105 TCID50 SARS-CoV-2 at week 24 after the first vaccination or at week 2 after the second vaccination, which was administered 31 wk after the first, and killed 4 d later. (B) SARS-CoV-2 S-binding IgG antibodies were determined by ELISA and endpoint titers of sera from individual mice from 3 to 30 wk following the single vaccination (black dots) and the samples obtained 2 wk after the second vaccination (orange dots) were plotted. The trend line (red) was determined by linear regression of log transformed geometric mean values for the 30 wk following the first vaccination. (C) Lentivirus pseudoviral neutralizing titers of sera from individual mice were determined and plotted as NT50 and color-coded as in B. The trend line was determined as in B, excluding values below the limit of detection. (D) Infectious SARS-CoV-2 in lungs and nasal turbinates was analyzed at 4 d after challenge of mice that had been vaccinated once (1×). Individual and geometric mean TCID50 are shown. (E) Same as D, except mice were vaccinated twice (2×). (F) The sgN (shaded) and sgS (unshaded) RNAs in the lungs and nasal turbinates of mice vaccinated 1× were determined by ddPCR and normalized to 18S rRNA. Values for individual mice and the geometric means are shown. (G) Same as F, except that mice were vaccinated 2×. Significance: **P ≤ 0.006.

