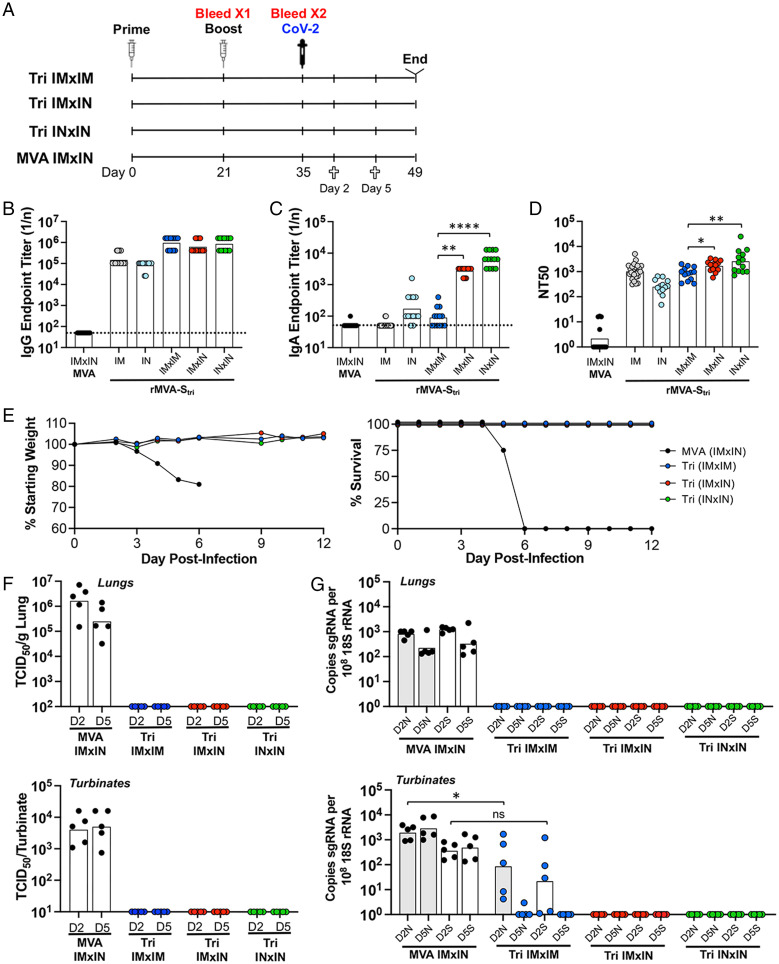
Fig. 5.
Comparison of immune responses and protection following IN and IM vaccinations. (A) K18-hACE2 mice were primed and boosted with rMVA-Stri by IN or IM route to form three groups of 13 mice: IMxIM, IMxIN, and INxIN. In addition, a control group received MVA IM followed by MVA IN. Mice from each group were bled at 3 wk after the prime and 2 wk after the boost. At the latter time, mice were challenged by IN inoculation of 105 TCID50 of SARS-CoV-2. On days 2 and 5 after challenge, five mice from each group were killed and three remained to follow weight and morbidity. (B and C) Serum IgG and IgA endpoint ELISA titers are shown for individual mice and the geometric mean. The dashed line represents the limit of detection. (D) Individual and geometric mean pseudovirus neutralizing titers are shown. (E) Three mice of each group were monitored for weight loss and survival. (F) At days 2 and 5 after challenge with SARS-CoV-2, homogenates were prepared from the lungs and nasal turbinates of five mice from each group and the TCID50 of SARS-CoV-2 determined. (G) RNA was extracted from the homogenates and copies of sgN (shaded) and sgS (unshaded) RNA were determined by ddPCR and normalized to 18S rRNA in the same sample. Significance: *P = 0.04, **P < 007, ****P < 0.0001; ns, not significant.

