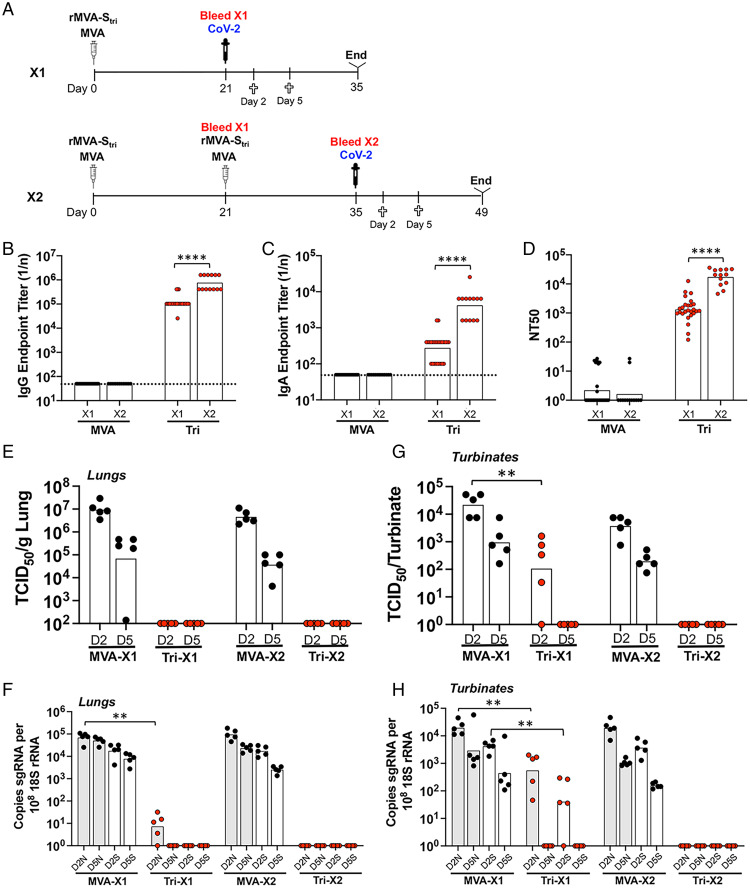
Fig. 6.
Comparison of immunity to SARS-CoV-2 and protection following one or two IN vaccinations. (A) K18-hACE2 mice were inoculated IN with rMVA-Stri once (1×, n = 13) or a second time (2×, n = 13) after 3 wk. Blood was collected prior to challenge with SARS-CoV-2 3 wk after the first vaccination and 2 wk after the second. At 2 and 5 d after challenge, blood was collected and the animals killed. (B and C) Serum IgG and IgA endpoint ELISA titers are shown for individual mice and geometric means. The dotted line represents the limit of detection. (D) Individual and geometric mean pseudovirus neutralizing titers are shown. (E) At days 2 and 5 after challenge with SARS-CoV-2, homogenates were prepared from the lungs of five mice from each group and the TCID50 of SARS-CoV-2 determined. (F) RNA was extracted from the same lung homogenates as in E and the copies of sgN (shaded) and sgS (unshaded) RNA determined by ddPCR and normalized to 18S rRNA in the same sample. (G) TCID50 determined from nasal turbinates. (H) RNA was extracted from same nasal turbinate samples as in G. Significance: *P < 0.05, **P, <0.008, ****P < 0.0001.

