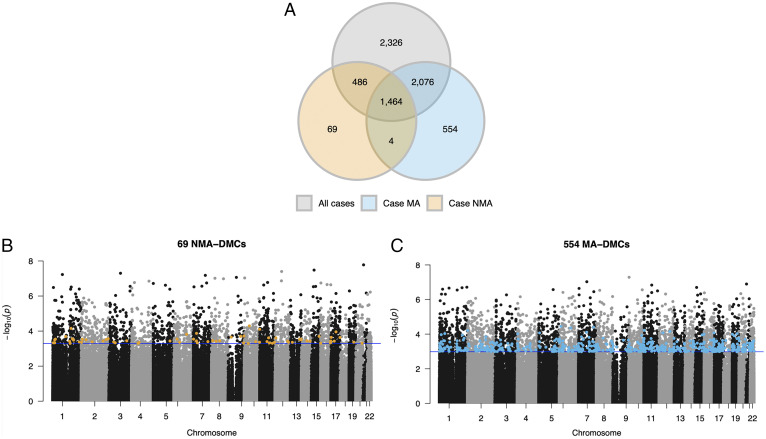
Fig. 1.
Comparisons of DMCs in MA risk groups. (A) Venn diagrams show the number of DMCs (FDR < 0.10) in each of three analyses: controls (n = 42) vs. all asthma cases (n = 88; all cases; gray), controls vs. asthma cases without an asthmatic mother (n = 56; Case NMA; orange), and controls vs. asthma cases with an asthmatic mother (n = 32; Case MA; blue). These comparisons revealed 6,352, 2,023, and 4,098 DMCs, respectively. Manhattan plots show the distribution and P values of 398,186 CpGs compared between nonasthma controls to Case NMA (B) and nonasthma controls to Case MA (C). P values (y axis) correspond to the differences in methylation between asthma cases and nonasthma controls. Blue horizontal lines correspond to the q value threshold of 0.10. Orange points in B indicate the 69 CpGs that were differentially methylated in Case NMA at FDR < 0.10 and blue points in (C) indicate the 554 CpGs that were differentially methylated in Case MA at FDR < 0.10.

