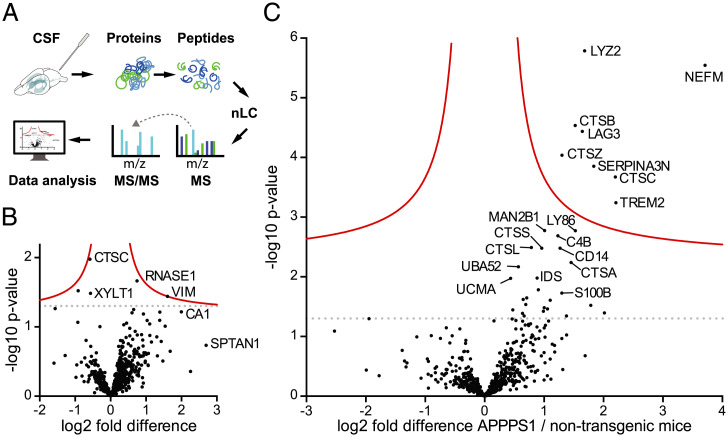
Fig. 2.
CSF proteome changes in APPPS1 mice at 3 and 18 mo of age compared to age-matched controls. (A) Workflow for mouse CSF proteome analysis: CSF was collected from the cisterna magna of anesthetized mice. After denaturation and alkylation, proteins were digested with Lys-C and trypsin. Resulting peptides were separated and eluted on a nano high-performance LC system. Subsequently, proteins underwent electrospray-ionization followed by MS analysis on a Q-Exactive Orbitrap Mass Spectrometer. The MS measurements were analyzed using MaxQuant software and UniProt database. (B) Protein abundances between 3-mo-old APPPS1 and non-tg control mice were compared (seven and eight male mice per group, respectively; note, one APPPS1 animal could not be measured due to an instrument failure). Each dot represents a protein that could be quantified in at least three CSF samples per group (SI Appendix, SI Materials and Methods). The –log10 of the P value of each protein is plotted against its log2 fold difference between APPPS1 and non-tg mice. No significant differences were found at 3 mo. (C) The same analysis was performed for 18-mo-old male APPPS1 mice and age-matched non-tg mice (eight animals per group). Dots above the solid red line indicate proteins that showed a significantly higher abundance in APPPS1 compared to age-matched non-tg mice. Significance cutoff (red line) is based on permutation-based FDR-corrected t tests (P < 0.05 and S0 = 0.1). The dotted lines indicate the threshold P = 0.05 (i.e., without correction for multiple hypothesis testing) (compare with Fig. 4A).

