Fig. 4.
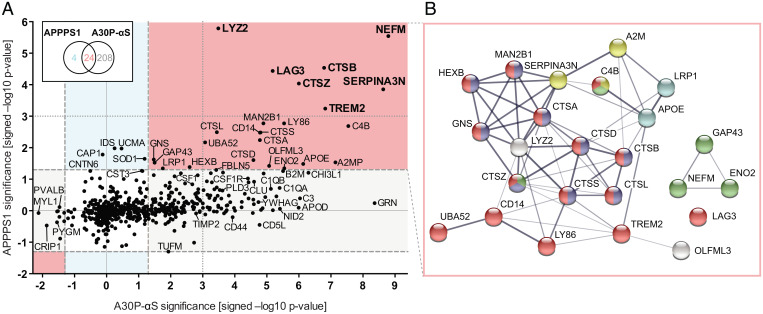
Meta-analysis of CSF proteome changes. (A) Probability values (displayed as –log10 P values) of individual CSF protein changes in the aged (18-mo-old) A30P-αS versus age-matched non-tg mice are plotted against those in aged APPPS1 versus age-matched non-tg mice for each analyte. These are the same mice as presented in Figs. 2 and 3. Note: positive values indicate an increase while negative values signify a decrease. Proteins with P < 0.05 (i.e., >1.3 on the –log10 scale) in both datasets reflect a general increase: that is, both mouse models showed an abundance difference between tg and non-tg animals at 18 mo of age (red sector), while P < 0.05 in either the A30P-αS (gray) or the APPPS1 (blue) dataset rather point at pathology-specific modulations. Note: Although LCN2 also appeared to be increased in both aged APPPS1 and A30P-αS mice, it escaped the APPPS1 analysis since it was quantified in less than three 18-mo-old wild-type mice; dashed lines indicate the threshold of P = 0.05 (i.e., not corrected for multiple hypothesis testing) (compare with Figs. 2 and 3). Bold letters indicate the proteins that were significantly up-regulated in aged tg mice of both disease models after FDR correction. (B) Protein–protein interaction of CSF analytes changing in response to pathology in both mouse models (as displayed in A, red sector) revealed 7.5 times more interactions than would be predicted for a random set of proteins of comparable size (i.e., 60 vs. 8 edges, respectively; protein–protein interaction enrichment P < 1.0e-16). Line thickness corresponds to the strength of data support. Color code based on functional enrichment analysis: “immune system” (red; reactome pathway), “lysosome” and “axon” (blue and green, respectively; GO Cellular Components), “serine-type endopeptidase inhibitor activity” (yellow; GO Molecular Function), and “cholesterol metabolism” (cyan; KEGG pathway).

