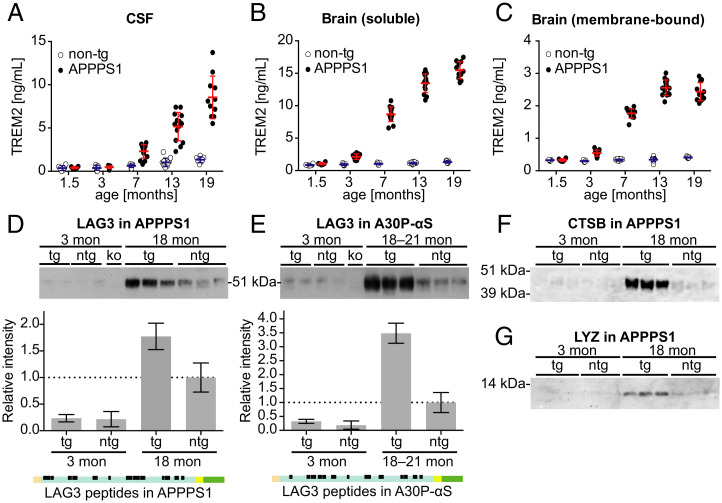
Fig. 6.
Biochemical validation of age- and transgene-related changes of selected glia-associated CSF proteins in APPPS1 and A30P-αS mice. (A–C) Using an ECL-based immunoassay, TREM2 was measured in the CSF (A), and soluble (B) and membrane-bound brain fraction (C) from a new cohort of APPPS1 and non-tg mice ranging from 1.5 to 19 mo of age (males, n = 6–15 per group) (see also SI Appendix, SI Materials and Methods). Bars indicate mean ± SD. (A) Two-way ANOVA revealed a significant age × genotype interaction for CSF TREM2; F(4, 89) = 21.4, P < 0.0001. Tukey's post hoc test showed a significant increase in 7-mo-old APPPS1 compared to age-matched non-tg and 1.5-mo-old APPPS1 mice (P < 0.0001; note, values of one 1.5- and two 3-mo-old non-tg mice were below limit of detection). (B) Quantification of TBS-soluble brain TREM2 levels was done in the same mice. Two-way ANOVA revealed a significant age × genotype interaction; F(4, 92) = 241.8, P < 0.0001. Tukey's post hoc test showed that soluble brain TREM2 in APPPS1 mice was significantly increased starting at 3 mo of age compared to age-matched non-tg and 1.5-mo-old APPPS1 mice (P < 0.0001). (C) Quantification of membrane-associated brain TREM2 levels (TBS/Triton-soluble fraction) in the same mouse cohort. Two-way ANOVA revealed a significant age × genotype interaction F(4, 89) = 210.4, P < 0.0001. Tukey's post hoc test showed that membrane-bound TREM2 was significantly increased in 3-mo-old APPPS1 mice compared to age-matched non-tg and to1.5-mo-old tg mice (P < 0.0001) but reached a plateau at 13 mo. Note: Two samples (1.5-mo-old non-tg and 7-mo-old APPPS1 mouse) could not be measured and one value (7-mo-old non-tg mouse) was excluded because it was a significant outlier (i.e., 6.4 SD greater than the mean of all non-tg mice). All P values of post hoc comparisons (for A–C) are reported in SI Appendix, Table S1. (D) Immunoblotting of CSF samples from APPPS1 tg mice using a LAG3 antibody revealed the expected 54-kDa band corresponding to soluble LAG3 (88). Semiquantitative analysis revealed that 18-mo-old APPPS1 mice had about 77% more CSF LAG3 than age-matched non-tg controls (ntg), compared to a threefold difference based on MS (compare with Fig. 2C). LAG3 was barely detectable in the CSF of non-tg and 3-mo-old APPPS1 tg mice and no signal appeared in the Lag3 knockout (ko) mouse (n = 2 and 3 mice per group in young and aged mice, respectively). (E) The same LAG3-related protein band was detected in CSF samples of A30P-αS tg mice. Semiquantitative analysis revealed that A30P-αS mice had about 3.5 times more LAG3 in the CSF than non-tg mice at 18 to 21 mo of age (the same difference that was quantified based on MS data; compare with Fig. 3C). Again, LAG3 was barely detectable in the CSF of non-tg and 3-mo-old A30P-αS tg mice, and no signal was seen in the Lag3 knockout (ko) control. Mean ± SD of signal intensities (n = 2 and 3 mice per group in young and aged mice, respectively). Topological representation of peptides mapped on LAG3 as determined by QARIP analysis (compare with Dataset S3). All detected peptides originate from the extracellular domain of LAG3 (D and E: orange, signal peptide; blue, extracellular domain; yellow, transmembrane domain; green, cytoplasmic domain). (F and G) Western blots for CTSB and LYZ in APPPS1 tg and non-tg mice at 3 and 18 mo of age (n = 3 per group). While in young animals no signal was detected, aged APPPS1 mice showed the expected bands for the two proteins (note: CSF samples from the same mice were used in F and G).

