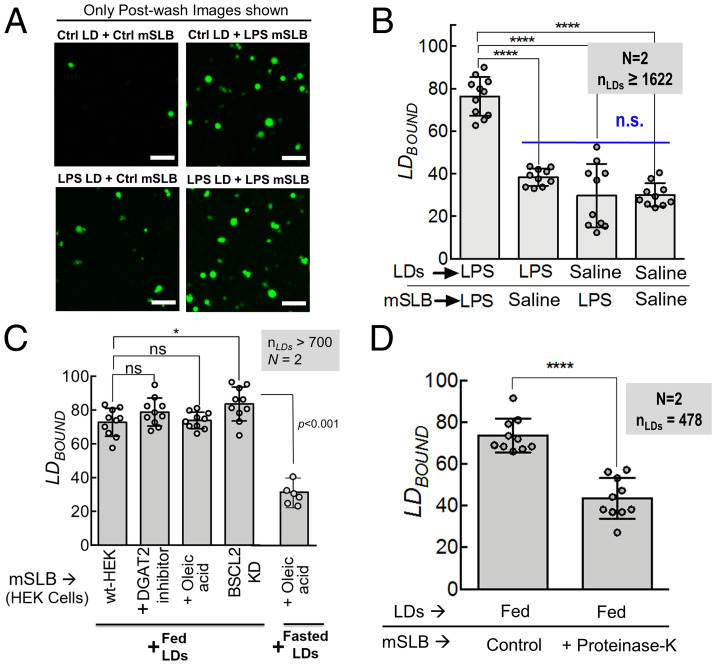
Fig. 2.
LD–mSLB contacts are sensitive to activation of immune response, but not to LD biogenesis. A) Representative fluorescence micrographs of LDs isolated from control (saline-injected, fasted) and LPS (LPS-injected, fasted) rat liver. LDs are labeled with BODIPY (green). LDs were incubated with mSLBs prepared from control (saline-injected, fasted) or LPS (LPS-injected, fasted) rats and imaged in four possible combinations. The flow cell was washed and LDs were imaged again. Only postwash images are shown. Scale bar, 10 μm. B) LDBOUND calculated as described from experiments in A. Each point on the graph represents the LDBOUND calculated from a single field of view (area, 18,090 μm2) containing multiple LDs. Data represent mean ± SD. ****P < 0.001, Mann–Whitney test. C) Quantitation of LDBOUND for fed-LDs or fasted-LDs binding to mSLBs isolated from HEK293T cells under different treatments. Each point on the graph represents the LDBOUND calculated from a single field of view (area, 18,090 µm2) containing multiple LDs. N represents number of independent experiments. Data represent mean ± SD. Mann–Whitney test. D) Quantitation of LDBOUND for fed-LDs binding to fed-mSLBs treated with proteinase K to digest exposed proteins on the membrane. Each point on the graph represents the LDBOUND calculated from a single field of view containing multiple LDs across independent experiments. Data represent mean ± SD. KD, knockdown; N, the number of independent pair of animals used in different experiments; nLDs, total number of LDs observed; ns, not significant; wt, wild type.

