Fig. 4.
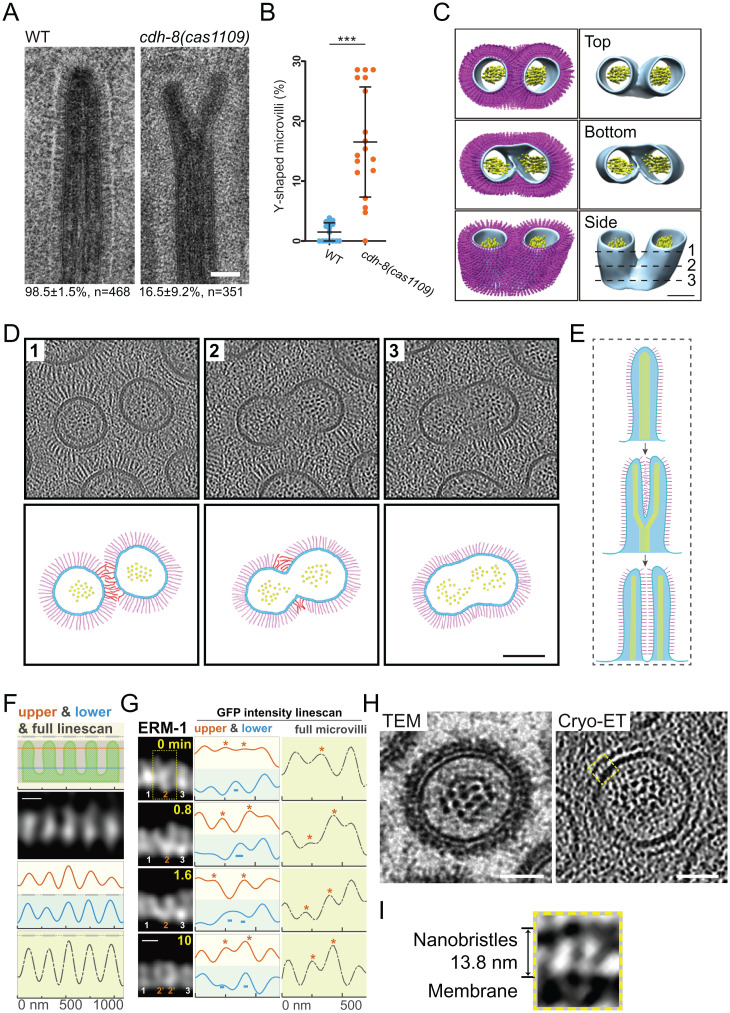
CDH-8 regulates microvillus assembly and a proposed model. (A) TEM images of microvilli in WT and the Y-shaped microvilli in cdh-8(1109) mutants. (Scale bar, 100 nm.) Below are percentages of the observed bristle-like microvilli or Y-shaped microvilli. (B) Quantification of Y-shaped microvilli in WT and cdh-8(1109) mutant animals. (C) The 3D reconstruction of the representative Y-shaped microvilli in WT animals. (Scale bar, 100 nm.) (D) Cryo-ET tomogram slices of the Y-shape microvilli. Lines 1 to 3 in C indicate the localization for tomographic slices in D, Upper. D, Lower shows the schematic. (Scale bar, 100 nm.) (E) A proposed role of nanobristles in microvilli division. Nanobristles, magenta; actin in microvilli, yellow; plasma membrane, cyan. (F) Schematics of high-resolution live-cell imaging of microvilli in a developing C. elegans larva using the Airyscan confocal microscopy. In the first row, the orange line (40 nm below the top of microvilli), the blue line (40 nm above the bottom of microvilli), and the gray bar (the entire microvilli) indicate the line scan for measuring the fluorescence intensity from microvilli images (ERM-1::GFP) in the second row or G. (Scale bar, 200 nm.) (G) Time-lapse fluorescence images of a Y-shaped microvillus separation into two nascent microvilli. The yellow boxes, asterisks, and − show the no. 2 microvillus separation, whereas other microvilli remained unchanged. (Scale bar, 200 nm.) (H) Cross-section TEM (Left) or cryo-ET image (Right) of mouse microvilli. A high-magnification view of the dotted yellow box in I. (Scale bars, 50 nm.) (I) The yellow boxed region shows nanobristle-like structures on the surface of mouse microvilli. *P < 0.05; ***P < 0.001.

