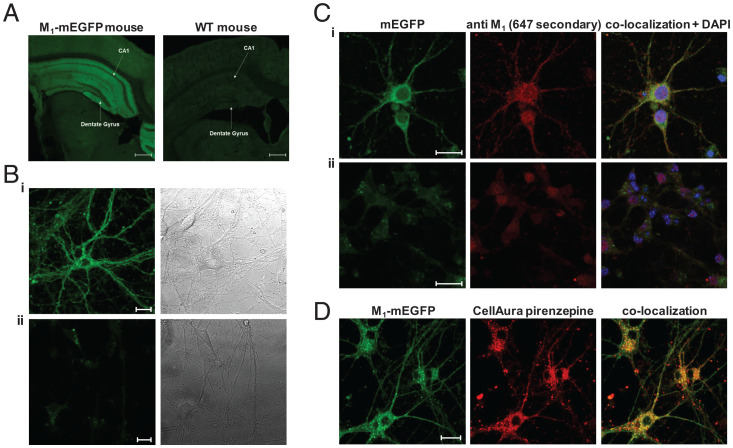
Fig. 3.
Images of M1-mEGFP expression. Fluorescence imaging of brain slices from homozygous M1-mEGFP and WT mice shows the profile of expression of M1-mEGFP. (A) The hippocampal CA1 region and the dentate gyrus are noted. Endogenous fluorescence of the mEGFP tag in the hippocampus is preserved following fixation. (B) Images of cultures of (B, i) M1-mEGFP–expressing or (B, ii) M1-knockout (KO) neurons (Left) with corresponding bright-field image (Right). (C) Immunostaining of such neurons from M1-mEGFP–expressing (C, i) or M1-KO (C, ii) neurons with an anti-M1 receptor antiserum shows strong colocalization with mEGFP fluorescence in C, i but not C, ii. DAPI (blue) provides nuclear staining. (D) Addition to such neurons of a fluorescent form of the M1 selective antagonist pirenzepine (100 nM; red) also shows strong colocalization with mEGFP fluorescence. Scale bars, 500 µm.

