Fig. 5.
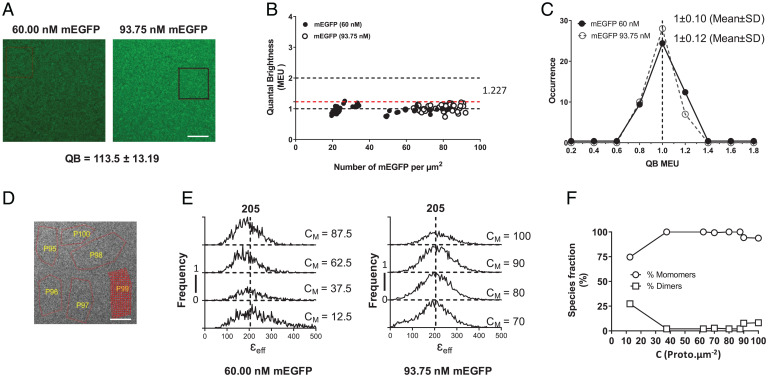
SpIDA and FIF spectrometry define the QB and monomeric state of mEGFP. Solutions of 60 nM and 93.75 nM mEGFP were imaged and analyzed by SpIDA. A total of 45 RoI were assessed for each concentration. (A) The highlighted box in the 93.75-nM image shows representative RoI. Scale bar, 20 µm. These provided QB values of 113.5 ± 13.2 (mean ± SD) for mEGFP. (B and C) SpIDA indicated that mEGFP is monomeric across all concentrations (B) (the dotted line = 1.227 is the median QB [designed as 1.00 MEU + 1.96 SD above MEU, which corresponds to 95% of the observations]) and that data were normally distributed around the MEU (C) (see refs. 13 and 43 for details). (D–F) FIF spectrometry was conducted on segmented elements (red; P99 in the image) of randomly selected RoIs (red outlines, P95 to P100) (D). Scale bar, 20 µm. We characterized 38 RoIs for 60.0 nM and 100 RoIs for 93.75 nM. (E and F) Analysis determined a monomeric brightness of 205 and confirmed that across the range of concentrations, mEGFP was monomeric apart from values at very low density (mean, 12.5 molecules/μm2) (see ref. 7 for full details). See text for further details of why analyses of RoIs with receptor density of fewer than 15 molecules/μm2 was excluded from the final data set. CM is the area concentration of the membrane in units of of protomers (proto).μm−2.

