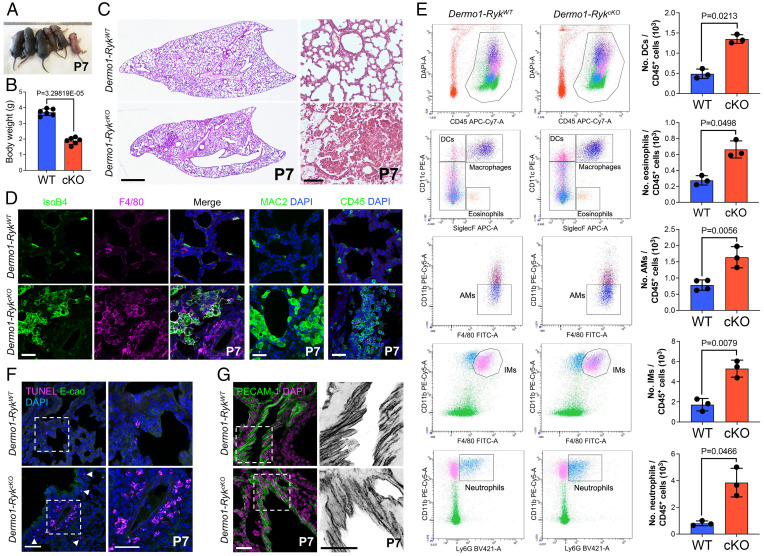
Fig. 2.
Mesenchymal Ryk deletion leads to lung inflammation. (A) General appearance of P7 Dermo1-RykWT (n = 3) and Dermo1-RykcKO (n = 3) mice. (B) Body weight of P7 Dermo1-RykWT (n = 6) and Dermo1-RykcKO (n = 5) mice. (C) H&E staining of P7 Dermo1-RykWT (n = 10) and Dermo1-RykcKO (n = 9) lung sections. (D) IsoB4 staining (immune cells) and immunostaining for F4/80 (alveolar and interstitial macrophages), MAC2 (alveolar and interstitial macrophages), and CD45 (hematopoietic cells) of P7 Dermo1-RykWT (n = 10) and Dermo1-RykcKO (n = 9) lung sections. (E) Representative flow cytometry analysis of CD45+ hematopoietic cells from the lungs of P3 Dermo1-RykWT (n = 3) and Dermo1-RykcKO (n = 4) mice. Bar graphs representing the number of alveolar macrophages (AMs), dendritic cells (DCs), eosinophils, interstitial macrophages (IMs), and neutrophils as measured by flow cytometry in the lungs of P3 Dermo1-RykWT (n = 3) and Dermo1-RykcKO (n = 4) mice. (F) TUNEL staining and E-cadherin immunostaining of P7 Dermo1-RykWT (n = 10) and Dermo1-RykcKO (n = 9) lung sections. High-magnification image of the areas in the dashed boxes is shown on the Right. Arrowheads point to TUNEL-positive cells. (G) Immunostaining for PECAM-1 of P7 Dermo1-RykWT (n = 10) and Dermo1-RykcKO (n = 9) lung sections. High-magnification image of the areas in the dashed boxes is shown on the Right. Error bars are means ± SEM, two-tailed Student’s t test. (Scale bars: 1 mm for C, Left; 100 μm for C, Right; 50 μm for F, Left; and 30 μm for D, F, Right, and G.)

