Fig. 4.
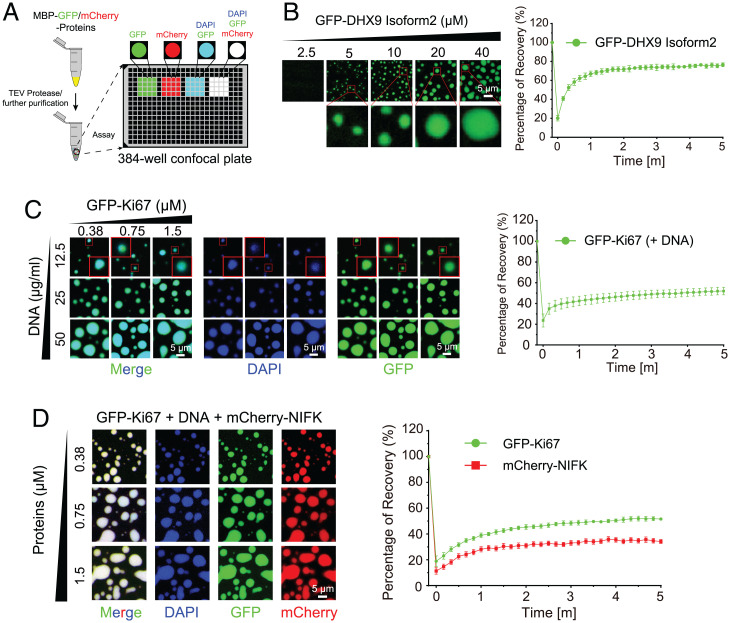
Experimental validation of DHX9 isoform2, Ki-67 truncation, and NIFK. (A) Schematic diagram of in vitro PS assay to illustrate the PS capacity of GFP or mCherry fused proteins after MBP removal. N-terminal MBP tags of MBP–GFP–DHX9 Isoform2, MBP–GFP–Ki-67 truncation and MBP–mCherry–NIFK were cleaved before droplet assembly with TEV protease overnight. Further droplet assembly for these proteins was performed on 384-well confocal plate. (B) Phase diagrams with blow-up images of GFP–DHX9 Isoform2 (Left). Quantitative results for FRAP analyses of the average recovery traces of GFP–DHX9 Isoform2 (Right). (C) Phase diagrams with blow-up images of GFP–Ki-67 truncation with DNA (Left). Quantitative results for FRAP analyses of the average recovery traces of GFP–Ki-67 truncation (Right). (D) Phase diagrams of GFP–Ki-67 truncation with DNA and mCherry–NIFK (Left). Quantitative results for FRAP analyses of the average recovery traces of GFP–Ki-67 truncation and mCherry–NIFK (Right).

