Fig. 5.
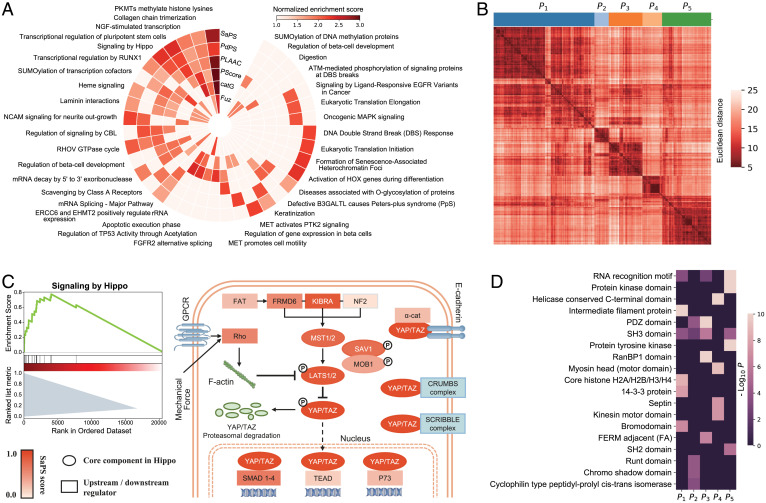
Functional analysis of self-assembling and partner-dependent candidates in the human proteome. (A) Single-sample GSEA of SaPS, PdPS, and another four representative PS predictors in the human proteome. Thirty-seven representative pathways are shown. If a method enriches any of the 37 pathways, the corresponding block would be colored according to its NES. (B) GSEA plot of Hippo pathway according to the scores of SaPS in the human proteome (Left). Schematic view of the Hippo pathway, in which the core components are shown as an ellipse, and the other regulators are shown as a rectangle. All components are colored according to their SaPS score (Right). (C) Clustering of 1,609 proteins with PdPS score greater than 0.8 into five sets according to the similarity of embedded protein sequences. The distance between clusters is measured by Ward’s minimum variance method. (D) Enriched domains in the five clustered sets of PdPS candidates. Nineteen representative domains are shown. If a cluster enriches any of the 19 domains, the corresponding block would be colored by −log10 P value.

