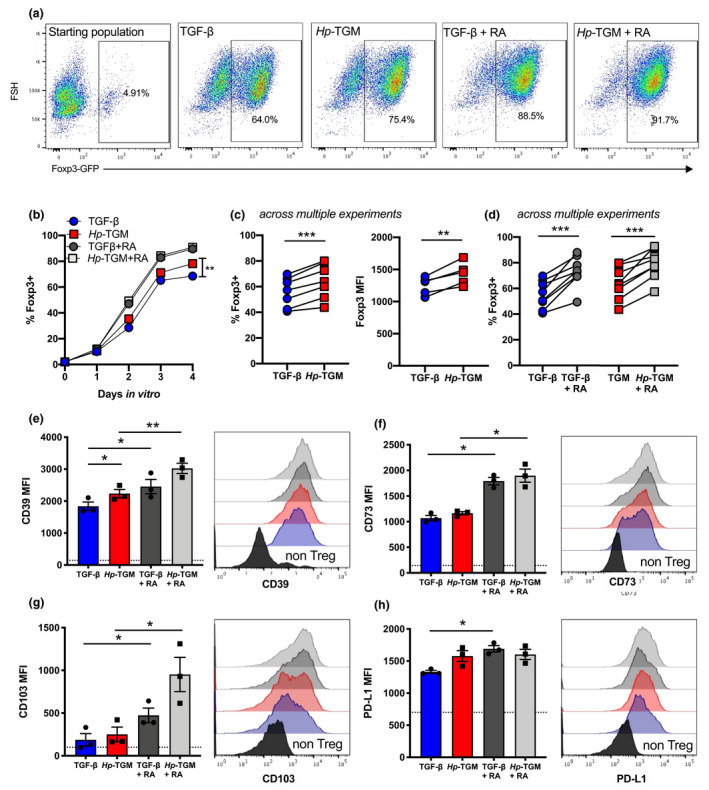
Figure 1.

Hp‐TGM and TGF‐β induce Foxp3+ iTregs with similar phenotypes. CD4+ T cells were isolated from the spleens of naïve male Foxp3‐GFP reporter BALB/c mice and cultured in the presence of plate‐bound anti‐CD3, IL‐2 with or without RA and either Hp‐TGM or TGF‐β for up to 4 days. (a) Representative expression of Foxp3‐GFP in the starting population (far left panel), and at day 4 for each treatment group, pregated on lymphocytes, single cells, live cells and CD3+CD4+ T cells. (b) Percentage of Foxp3(GFP)+ Tregs induced in vitro over time. (c, d) Percentage of induced Foxp3+ Tregs and Foxp3 MFI at day 4; data shown are from multiple experiments (c) without RA or (d) with RA addition. (e–h) After 4 days of culture the MFI of (e) CD39, (f) CD73, (g) CD103 and (h) PD‐L1 was assessed on Foxp3+ Tregs. Expression levels on the CD4+ T‐cell starting population are shown as a dashed horizontal line in bar charts and in solid black on histograms. Data shown are the mean of three biological replicates per sample from 3 or 5 independent experiments; error bars represent mean ± s.e.m. A paired t‐test was used to compare each set of groups. *P < 0.05, **P < 0.01, ***P < 0.001. GFP, green fluorescent protein; Hp‐TGM, TGF‐β mimic; iTregs, induced Tregs; MFI, mean fluorescence intensity; PD‐L1, programmed death‐ligand 1; RA, retinoic acid; TGF‐β, transforming growth factor‐beta; Tregs, regulatory T cells.
