Figure 3.

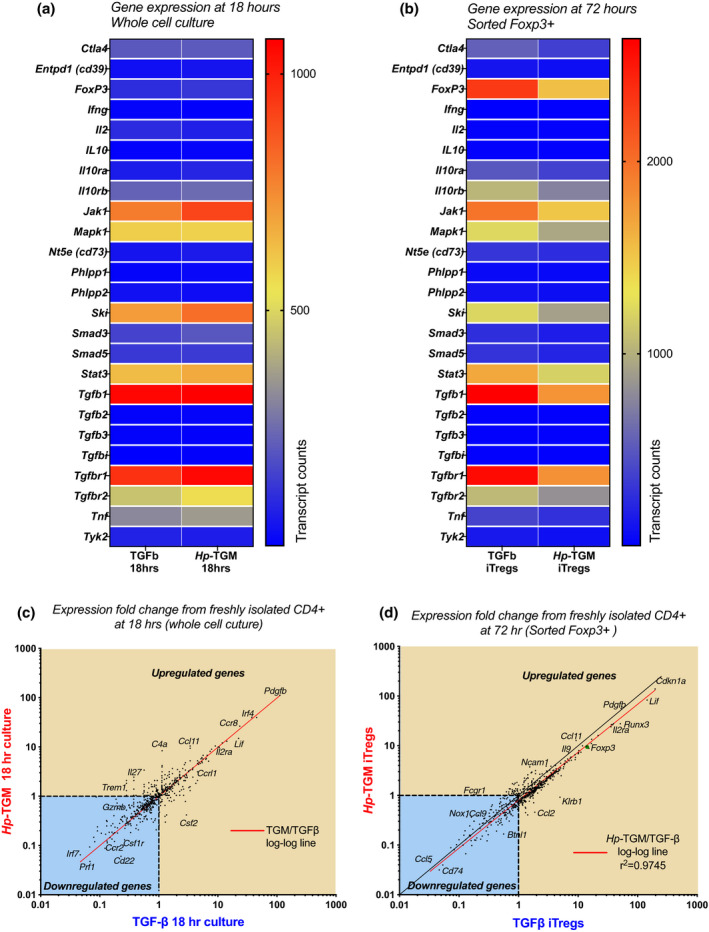
Hp‐TGM‐ and TGF‐β‐induced Foxp3+ Tregs had similar gene expression after 3 days in culture. CD4+ T cells were isolated from the spleens of naïve Foxp3‐GFP reporter BALB/c mice and cultured in the presence of anti‐CD3/anti‐CD28 beads, IL‐2 and either Hp‐TGM or TGF‐β for 18 or 72 h. Gene expression was analyzed using the mouse immunology gene set (V1) from NanoString on total cell populations at 18 h, and on cells sorted for Foxp3‐GFP expression at 72 h. (a) Heatmap showing the gene expression of isolated CD4+ T cells that were cultured in the presence of Hp‐TGM or TGF‐β for 18 h prior to analysis, with the blue color indicating a low level of gene expression and red color indicating a high level of gene expression as determined by the number of transcript counts. (b) Heatmap showing the gene expression of TGF‐β‐induced Tregs (TGF‐β iTregs) and Hp‐TGM‐induced Tregs (Hp‐TGM iTregs) which were sorted for Foxp3‐GFP expression after 72 h of culture prior to gene analysis. (c, d) Fold‐change comparison of genes from 18‐h‐cultured CD4+ T cells (c) and 72‐h Foxp3+‐sorted T cells (d), cocultured with Hp‐TGM or TGF‐β, relative to the freshly sorted CD4+ T‐cell starting population. The log–log line is indicated in red, and top right quadrant shows genes that are upregulated compared with fresh CD4+ control cells, and the blue‐shaded lower left quadrant indicates those that are downregulated. GFP, green fluorescent protein; Hp‐TGM, TGF‐β mimic; IL, interleukin; iTregs, induced Tregs; TGF‐β, transforming growth factor‐beta; Tregs, regulatory T cells.
