
Figure 5.
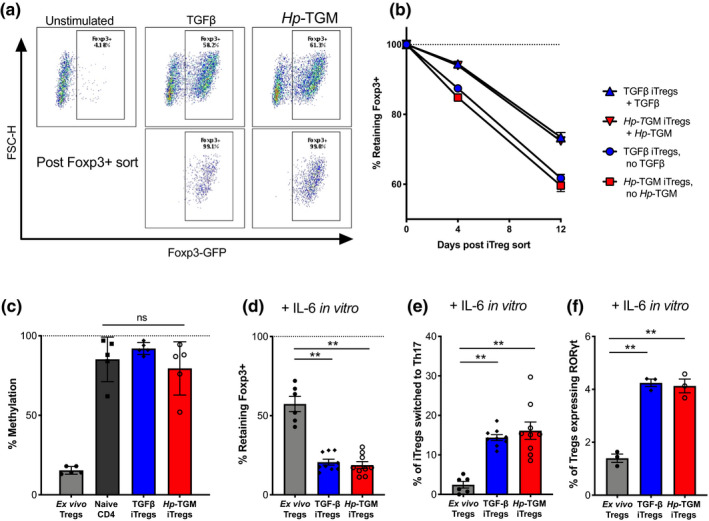
Hp‐TGM‐ and TGF‐β‐induced Foxp3+ Tregs showed similar levels of methylation and stability, and acted similarly under inflammatory conditions in vitro. (a) Naïve CD4+ T cells from male BALB/c‐Foxp3‐GFP mice were cultured with Hp‐TGM or TGF‐β to induce Foxp3+ Tregs (iTregs) that were sorted based on Foxp3‐GFP expression and used for downstream analysis in vitro as shown by the representative flow cytometry plots. (b) Percentage retention of Foxp3 expression among sorted Foxp3 loss over time in culture for Hp‐TGM‐ and TGF‐β‐induced Tregs in the presence of additional IL‐2, with or without Hp‐TGM/TGF‐β in the second step culture. (c) In vivo differentiated Foxp3+ Tregs (nTregs) show a high level of demethylation at the TSDR locus; however, Hp‐TGM‐ and TGF‐β‐induced Tregs after 12 days in culture have a similar level of methylation in freshly isolated naïve CD4+ T cells. (d) Percentage of IL‐6‐induced Foxp3 loss in sorted Hp‐TGM or TGF‐β‐iTregs that were cultured in the presence of IL‐6 for 4 days. (e) Percentage of iTreg cultures in d that converted to Th17 as evaluated by their expression of both RORγt and IL‐17A in the presence of IL‐6. (f) Percentage of iTregs that became double positive for RORγt and Foxp3 in the presence of IL‐6 for 4 days. Data are from three similar independent experiments (a–f). Shown are the means ± s.e.m. and data were analyzed using a one‐way ANOVA (c–f) with Dunnett’s multiple comparisons test comparing iTreg treatment groups with nTreg controls, and a paired t‐test between TGF‐β and TGF‐β + RA. **P < 0.01. FSC‐H, forward scatter‐height; GFP, green fluorescent protein; Hp‐TGM, TGF‐β mimic; IL, interleukin; iTregs, induced Tregs; NS, not significant; TGF‐β, transforming growth factor‐beta; Th, T helper; Tregs, regulatory T cells; TSDR, Treg‐specific demethylation region.