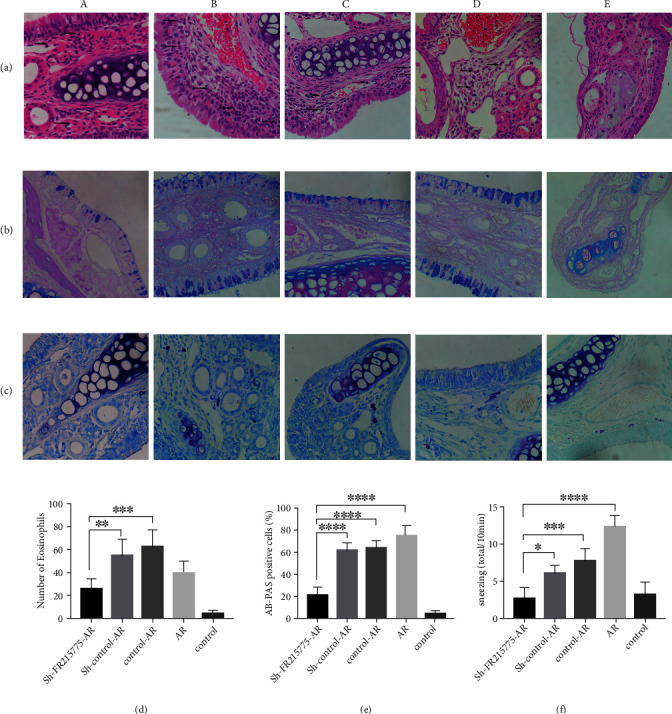
Figure 5.

Histopathological staining of murine nasal mucosa. Tissue sections were stained with (a) HE staining, (b) AB-PAS staining, (c) toluidine blue staining to analyze the severity of allergic inflammation. Photographs of representative nasal mucosal in each group (a–c; ×400 magnification; black arrows indicate stain positive cells). (d) Number of eosinophils. (e) Percent count of goblet cells. (f) Number of mast cells was significantly decreased in sh-FR215775 group (n = 5 per group). (A) The sh-FR215775 intervention AR group. (B) The sh-control intervention AR group. (C) The control cell intervention AR group. (D) The nonintervention AR group. (E) The blank control group. Data represent the mean ± SD (∗P < 0.05, ∗∗P < 0.01, ∗∗∗P < 0.001, ∗∗∗∗P < 0.0001).
