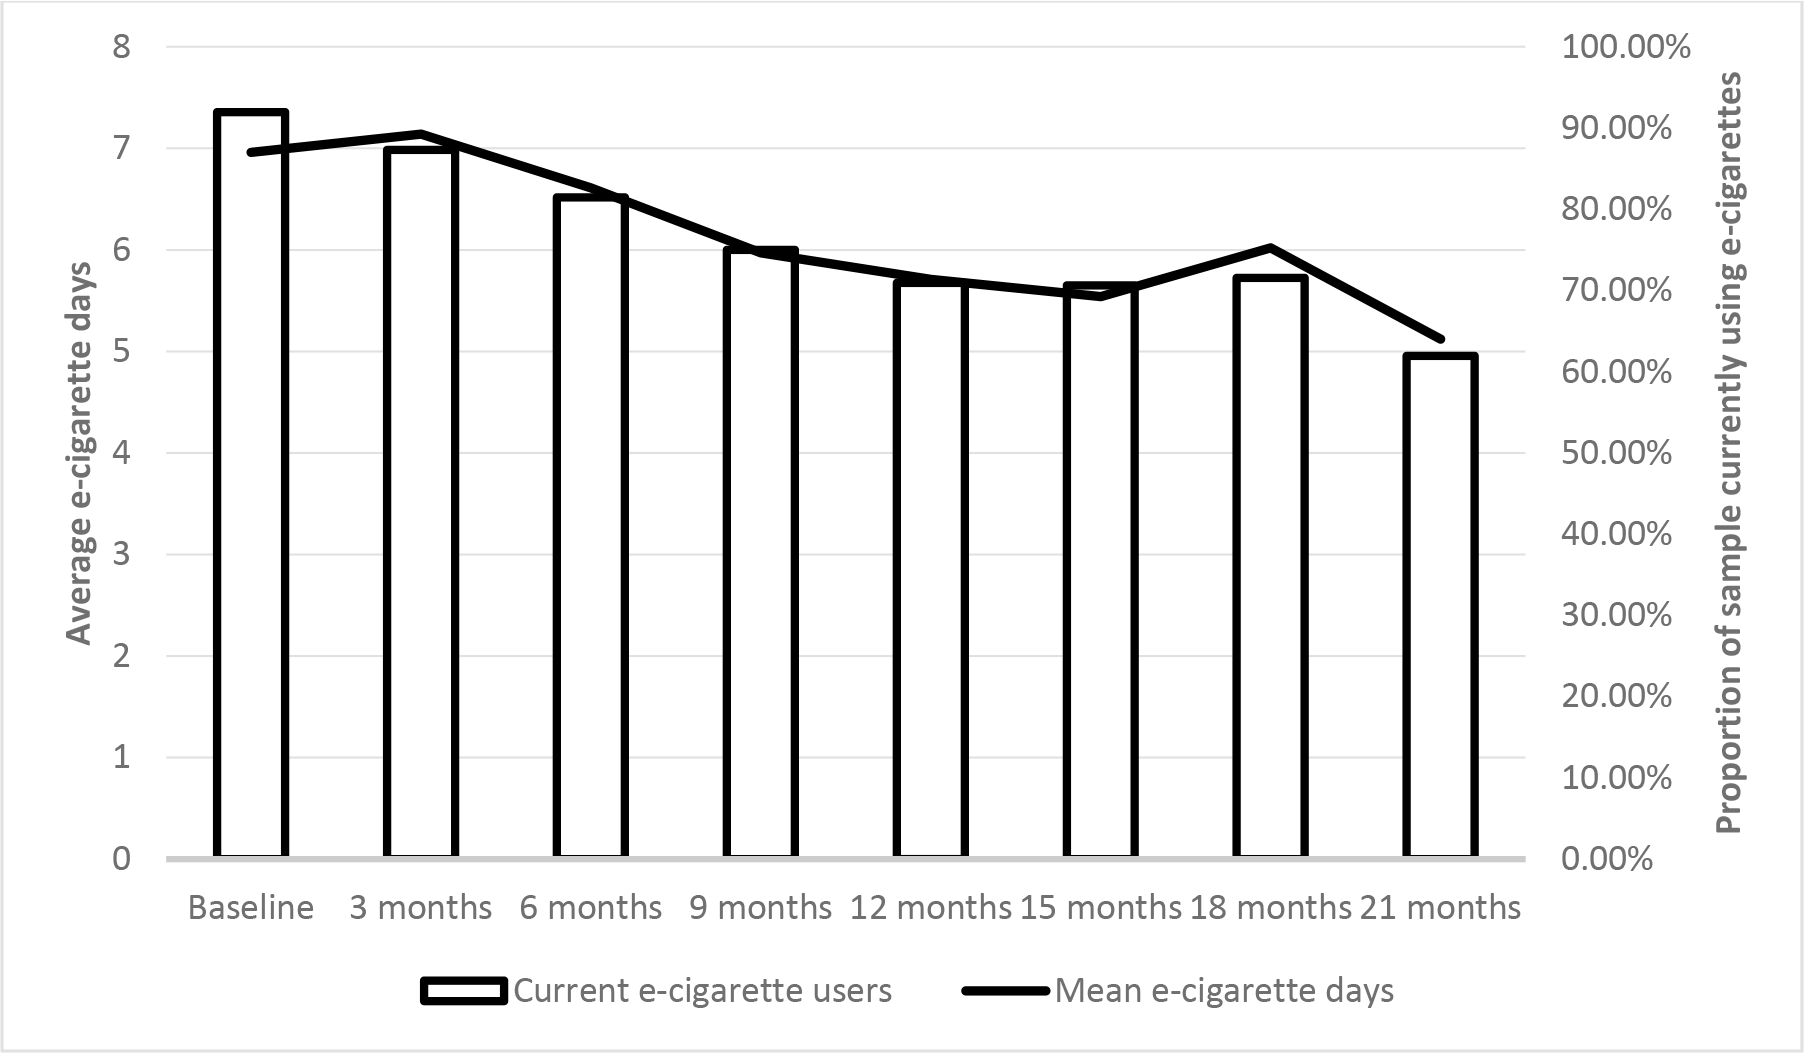
Figure 1. Frequency of e-cigarette use over time.

This represents the relationship between the current e-cigarette users (orange bars) with their average number of e-cigarette days of the past 14 days (blue solid line) at each wave of assessment.

This represents the relationship between the current e-cigarette users (orange bars) with their average number of e-cigarette days of the past 14 days (blue solid line) at each wave of assessment.