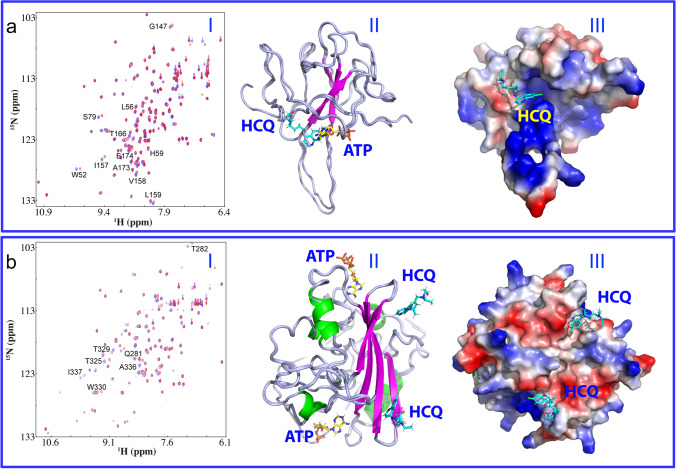
Fig. 2.
ATP and HCQ specifically bind NTD and CTD. a (I) Superimposition of HSQC spectra of NTD in the free state (blue) and in the presence of HCQ at 1:15 (NTD:HCQ) (red). The significantly perturbed residues are labeled. (II) Superimposition of the structures of the ATP-NTD and HCQ-NTD complexes with ATP and HCQ displayed in stick. (III) the structure of the HCQ-NTD complex with HCQ in stick and NTD in the electrostatic potential surface. b (I) Superimposition of HSQC spectra of CTD in the free state (blue) and in the presence of HCQ at 1:7.5 (CTD:HCQ) (red). The significantly-perturbed residues are labeled. (II) Superimposition of the structures of the ATP-CTD and HCQ-CTD complexes with ATP and HCQ in stick. (III) the structure of the HCQ-CTD complex with HCQ in stick and CTD in the electrostatic potential surface

