Fig. 2.

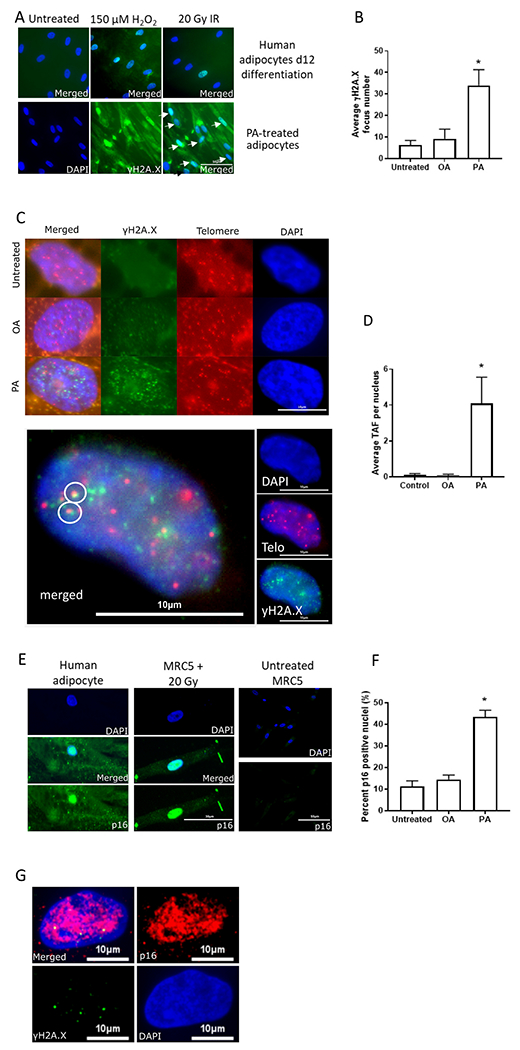
Effect of 4 days 150 nM FFA treatment on senescence markers in human primary subcutaneous adipocytes (Lonza). A) Comparison of γH2A.X DNA damage foci in controls after 150 μM H2O2 and 20 Gy x-irradiation (IR) (upper row, merged images), and PA treatment in differentiated (12 days) human adipocytes (lower row, single plus merged image) (400×, scale bar is 50 μm). B) Average γH2A.X DNA damage focus counts per nucleus after FFA treatment. C) Upper row: representative images from control and OA- and PA- treated adipocytes. Blue: DAPI nuclear staining, green: γH2A.X, red: telomere probe (400×, scale bar is 10 μm). In the left column are the merged ones. Lower row: An enlarged image of a nucleus with TAFs. Small insets on the right: DAPI staining (blue), telomere probe (red), and γH2A.X signal (green). (400×). Large image on the left shows co-localization of DNA damage and telomeres in white circles. D) Average telomere-associated focus count per nucleus after FFA treatment. E) Representative images of p16INK4a IF staining in MRC-5 fibroblasts10 days after 20 Gy x-IR (middle row, scale bar is 30 μm) and human primary subcutaneous adipocyte after 4 days of PA treatment (left row) as well as a negative control of untreated MRC-5 on the right at 400× magnification (scale bar is 50 μm) (Top: DAPI only, Middle: Merged, Bottom: p16INK4a only. For untreated MRC5 cells, only DAPI (top) and p16INK4a (bottom) are provided. F) Percentage of p16INK4a -positive nuclei quantified by immunofluorescence staining after FFA treatment. G) Double IF staining for p16INK4a (red) and γH2A. X (green) of a PA-treated adipocyte (400×, scale bar is 10 μm). * p < 0.05 by one-way ANOVA and Holm-Sidak post hoc test. (For interpretation of the references to colour in this figure legend, the reader is referred to the web version of this article.)
