
Figure 3. PSPC1 negatively regulates activation of bivalent genes in the pluripotent-state transition.
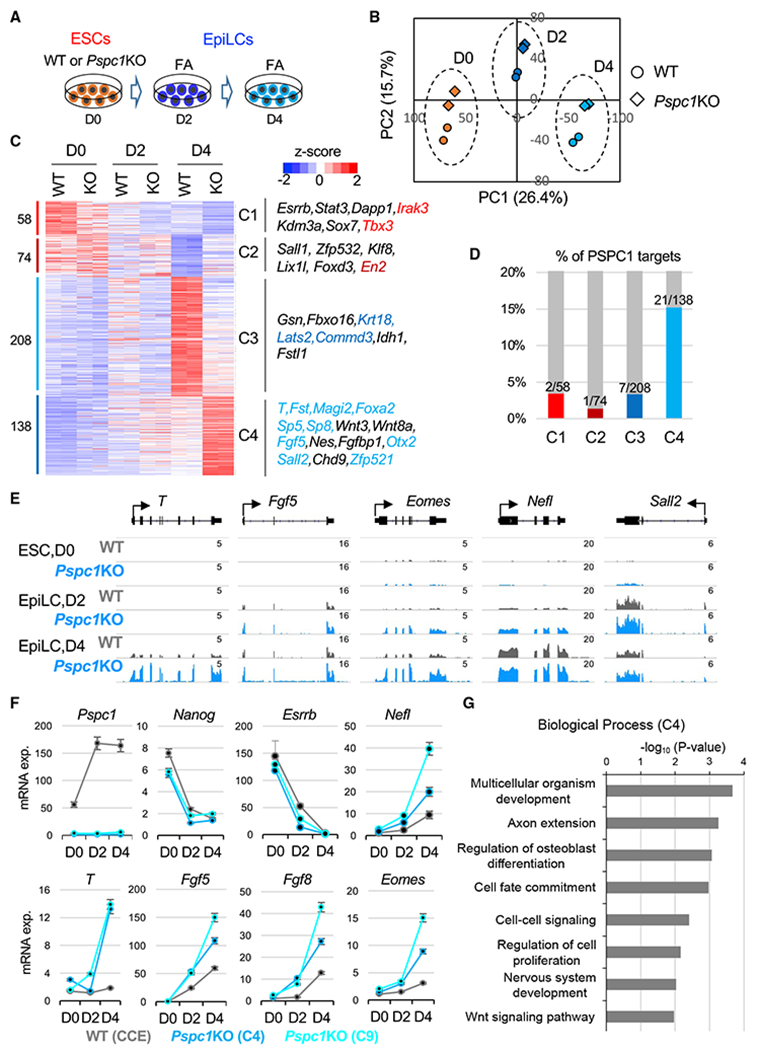
(A) Schematic depiction of the naive-to-formative transition of WT and Pspc1KO ESCs. The ESCs are adapted in Fgf2 and activin A (FA) culture medium for 2 days and 4 days.
(B) Principal-component analysis (PCA) of WT and Pspc1KO RNA-seq samples at different time points. Percentages of variance explained in each principal component (PC) are indicated.
(C) Heatmap showing the relative expression of differentially expressed genes (DEGs) by comparing D0 WT with D4 WT cells and D4 WT with D4 KO cells. The numbers of DEGs are shown on the left, and representative genes in the four classes (C1–C4) are listed on the right. The direct PSPC1 targets from ChIP-seq analysis are indicated by the color text, which matches the color of the histogram in (D).
(D) Histogram showing the percentages (%) and numbers of DEGs in each class (C1–C4) as the PSPC1 ChIP-seq targets.
(E) RNA-seq tracks of WT and Pspc1KO ESCs and EpiLCs at bivalent lineage gene loci. The numbers indicate the normalized RPM value of the tracks.
(F) RT-qPCR analysis of pluripotency and lineage genes in WT and Pspc1KO ESCs (CCE background with two independent clones, C4 and C9) during ESC-to-EpiLC differentiation. Error bars represent the standard deviation of technical triplicates.
(G) Gene ontology (GO) analysis for the C4 genes (Class 4, N = 138) shown in (C).