
Figure 2. Serum and stool metabolites significantly associated with various IBD disease attributes.
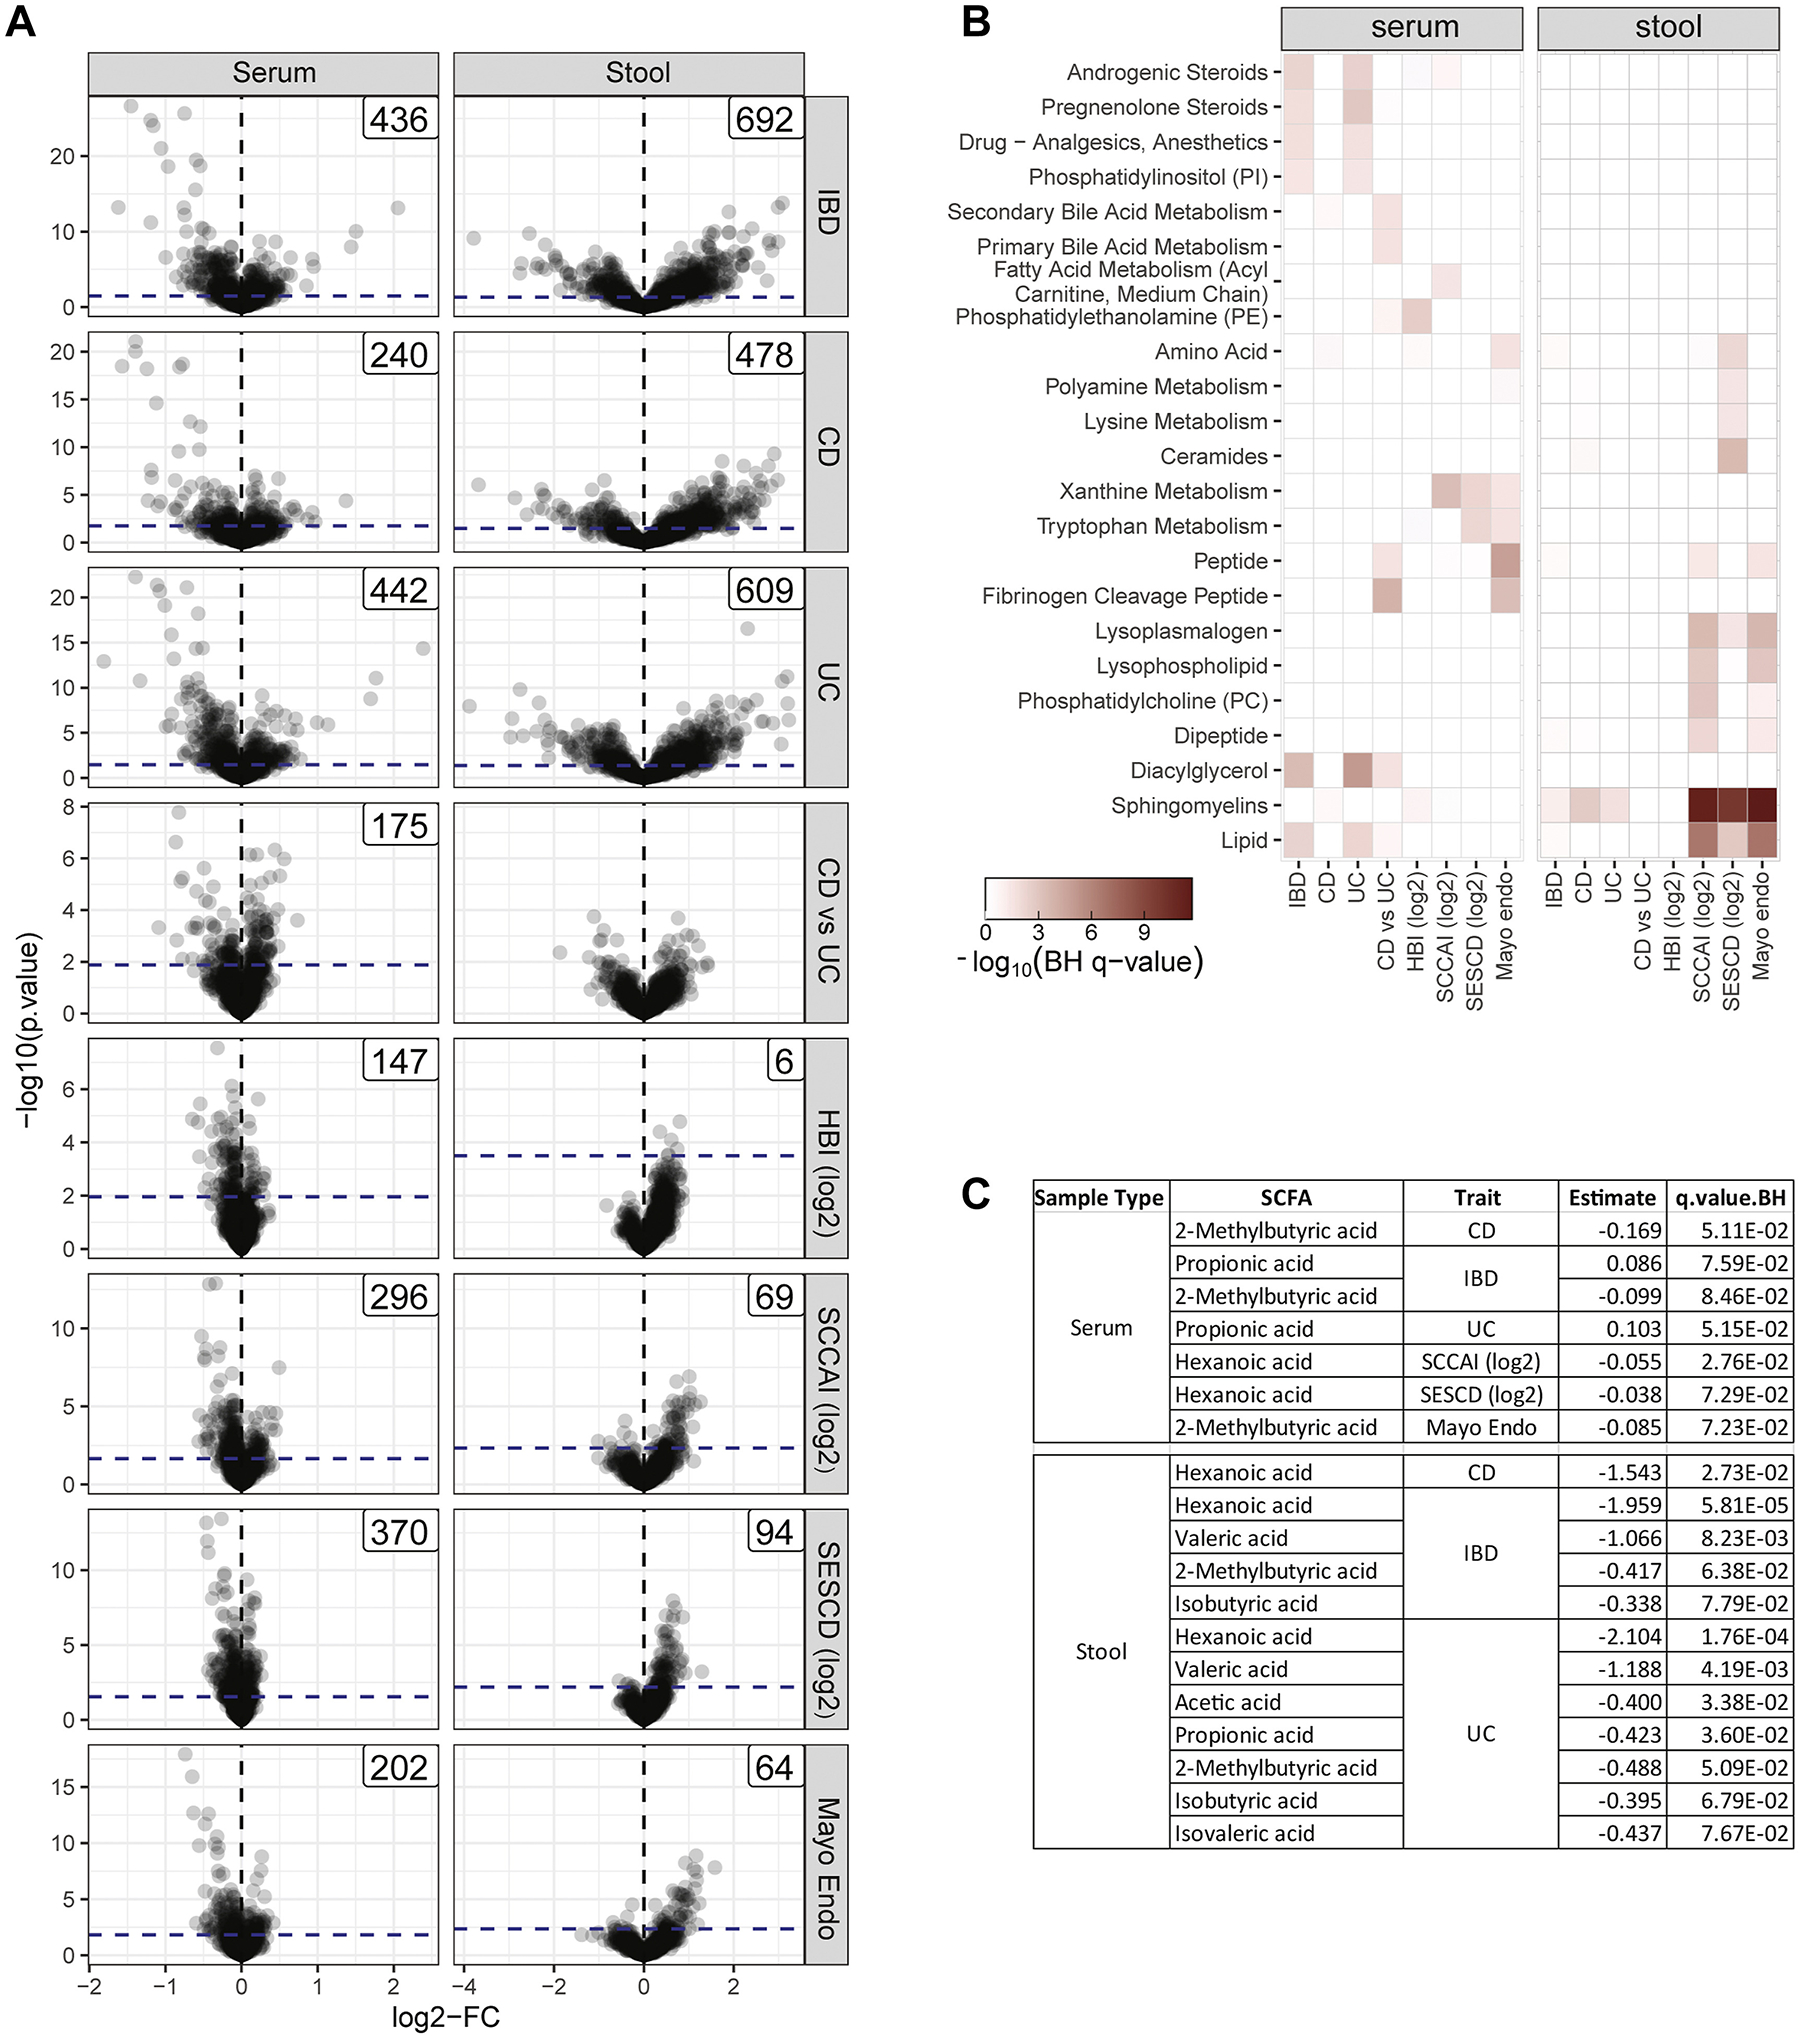
A) Volcano plots showing the DMA of the serum (left panel) and stool samples (right panel), according to the comparisons of interest including: IBD vs control (IBD); CD vs control (CD); UC vs control (UC); and CD vs UC as well as associations to clinical disease activity indices (log2HBI and log2SCCAI) and endoscopy scores (log2SESCD and Mayo_endo). We indicated the 10% FDR threshold as a dashed blue line and the number of DMs). B) A heatmap summarizing the enrichments of the serum and stool DMs according to metabolite classifications. Only classifications that were significantly enriched at FDR <0.05 for at least one endpoint are shown. C) Summary of differentially expressed SCFAs according to endpoint with effect and FDR. Only SCFAs passing FDR <0.10 are shown (Table S2).