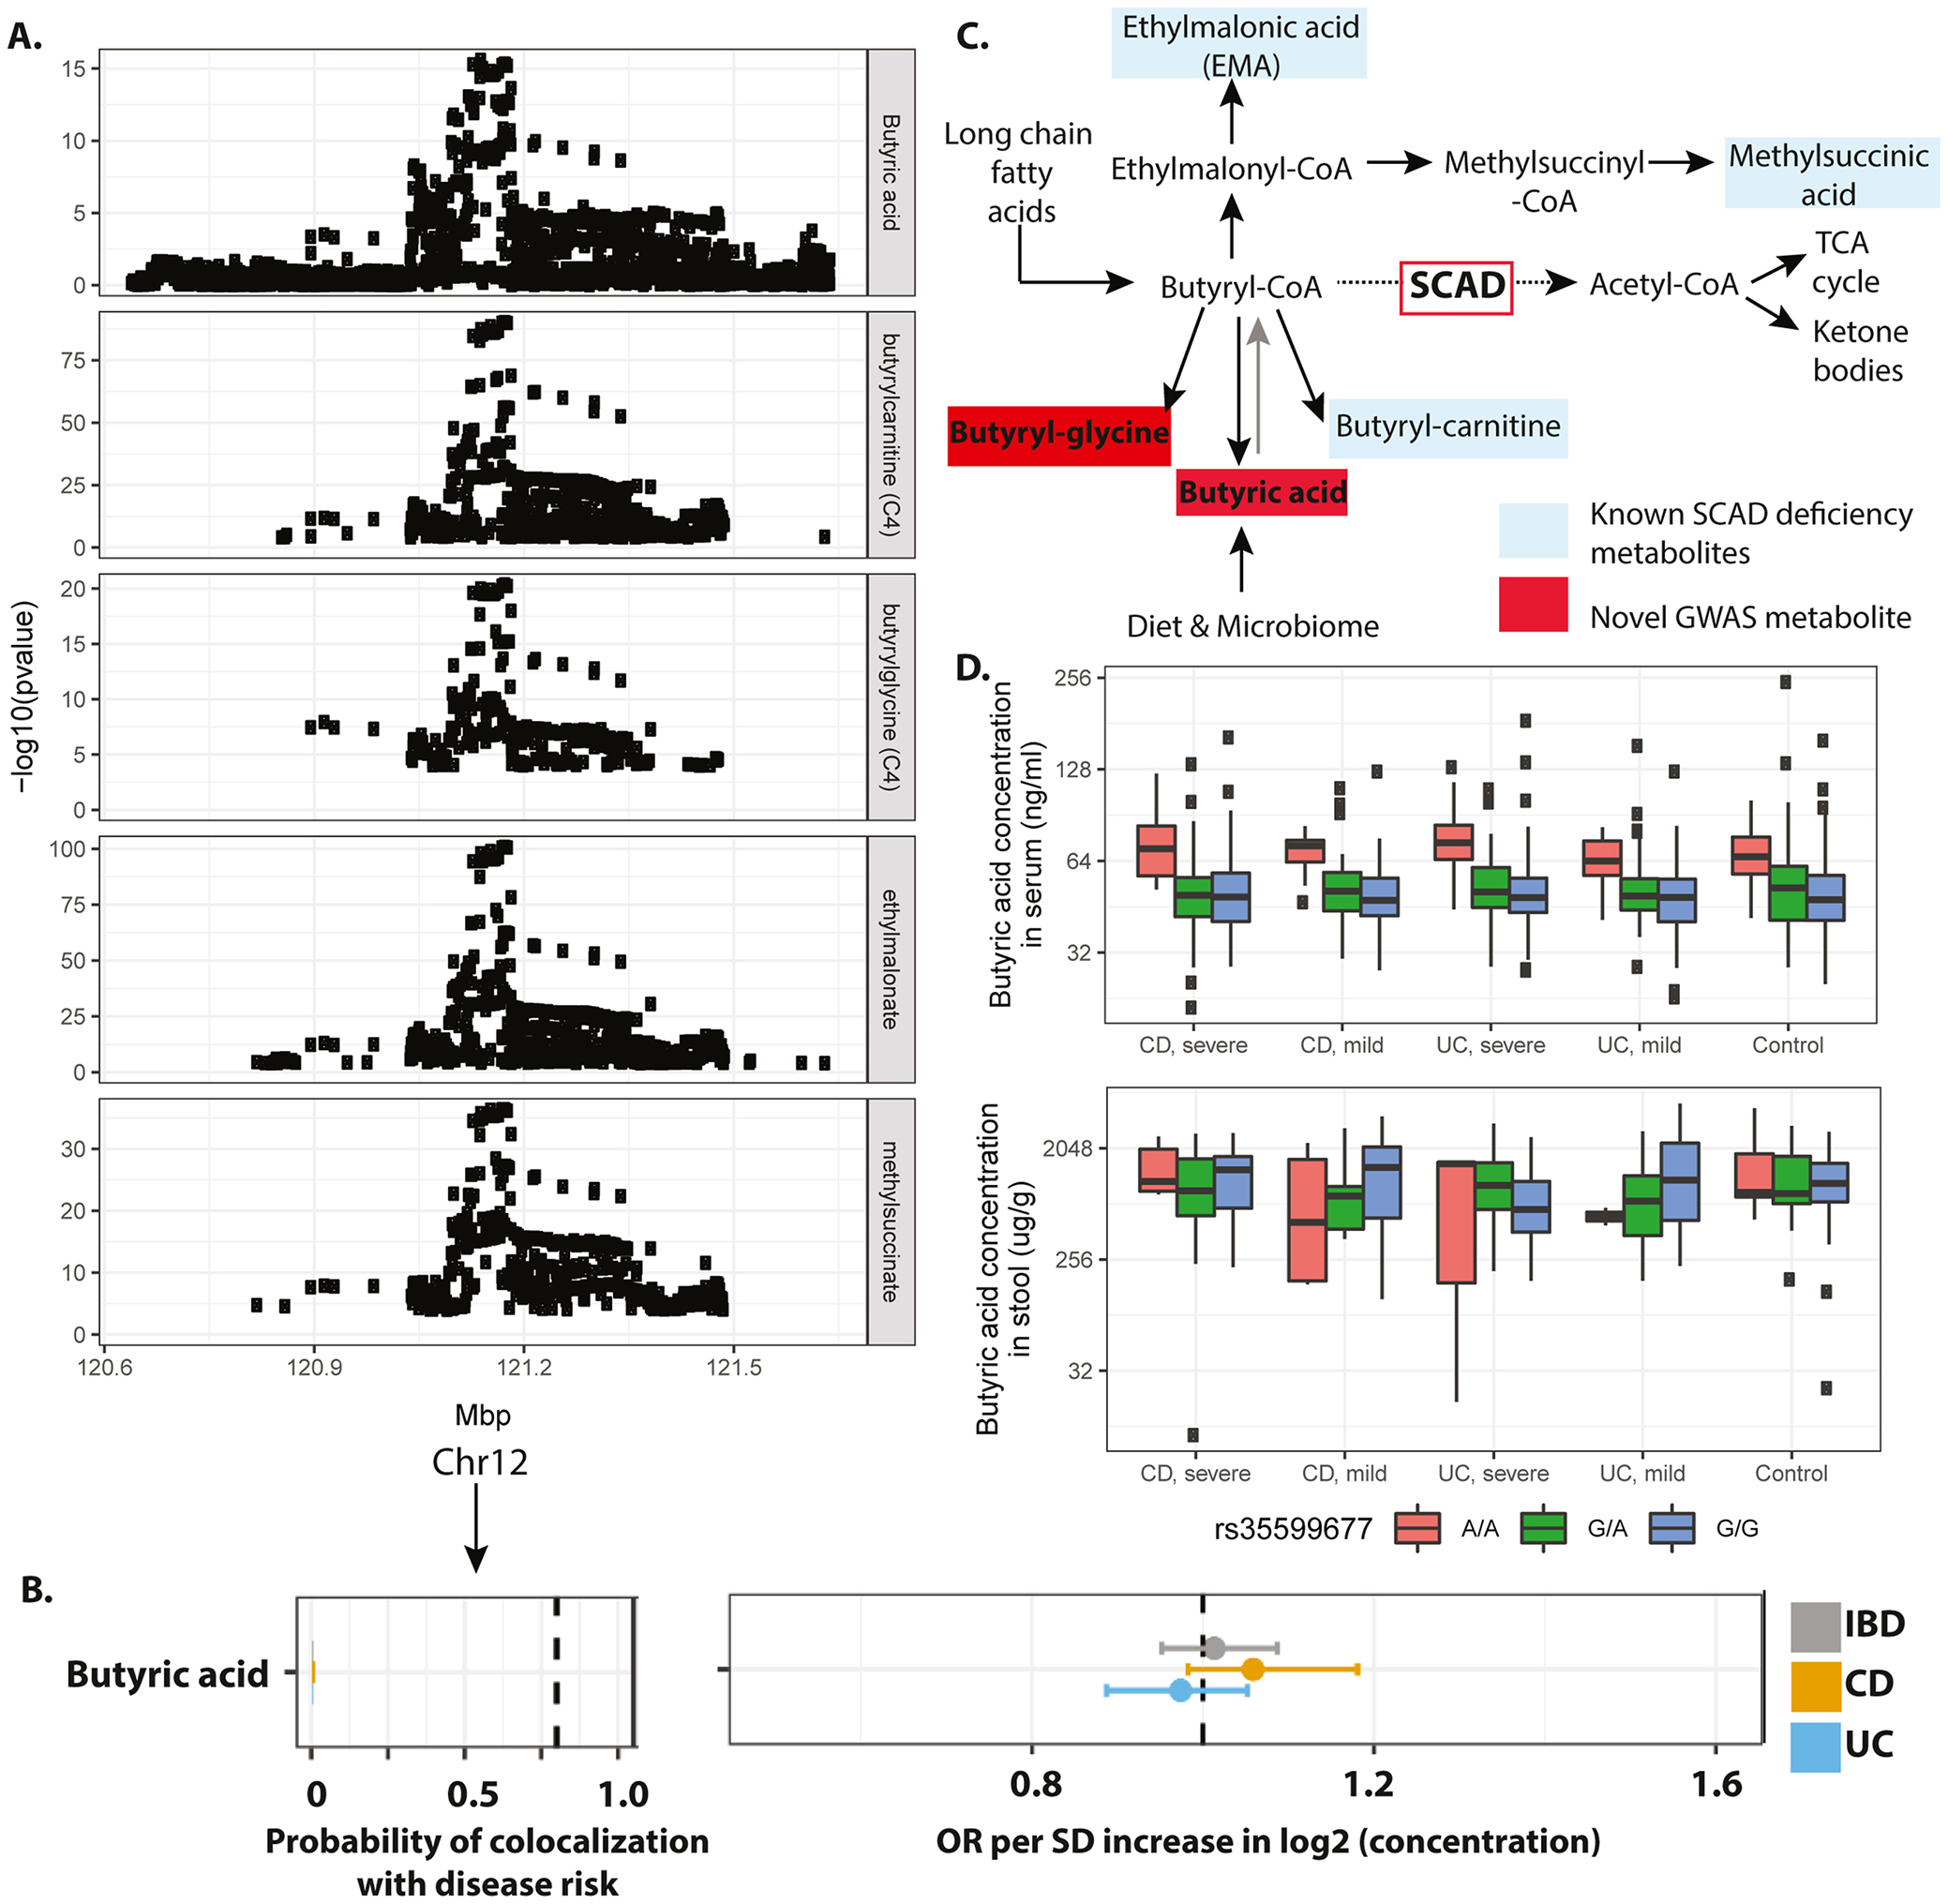
Figure 3. Genetic control of serum butyrate and lack of association with IBD-related traits.

A) Manhattan plots displaying the GWAS results of butyrate and various related metabolites (rows). Genome-wide significance threshold: 5E-8/1300=3.8E-11. B) Results of genetic colocalization between IBD, UC or CD risk and serum butyrate levels as well as results of the MR analysis. Metabolites on the vertical axis, estimates on the horizontal axis, genetic regions in vertical stripes. Posterior colocalization probabilities (left panel), and causal OR (right panel). Within each panel, a dotted vertical line highlights a point of interest: 0.8 posterior probability of colocalization on the left panel, and OR=1 on the right panel. Hatched line indicates position of OR=1, values to the right of the hatched line indicate higher levels of the corresponding metabolite are associated with increased risk and values to the left of the hatched line indicate the opposite. Colocalization and OR estimates were based on summary statistics from the present study (metabolome GWAS) and de Lange et al11 (IBD GWAS). C) Biochemical schema showing metabolic substrates and products of SCAD. Metabolites shaded in red are novel GWAS observations and those in blue are known ACADS GWAS associations. D) Serum (upper panel) and stool (lower panel) butyrate levels grouped by i) genotype at the rs35599677 locus and ii) disease severity as measured by endoscopic assessments. Mayo Scores ≥1 were classified as severe, scores <1 as mild. SESCD ≥3 were classified as severe, <3 as mild.
