
Figure 5. TMEM229B expression and choline plasmalogens as candidate mediator of CD risk.
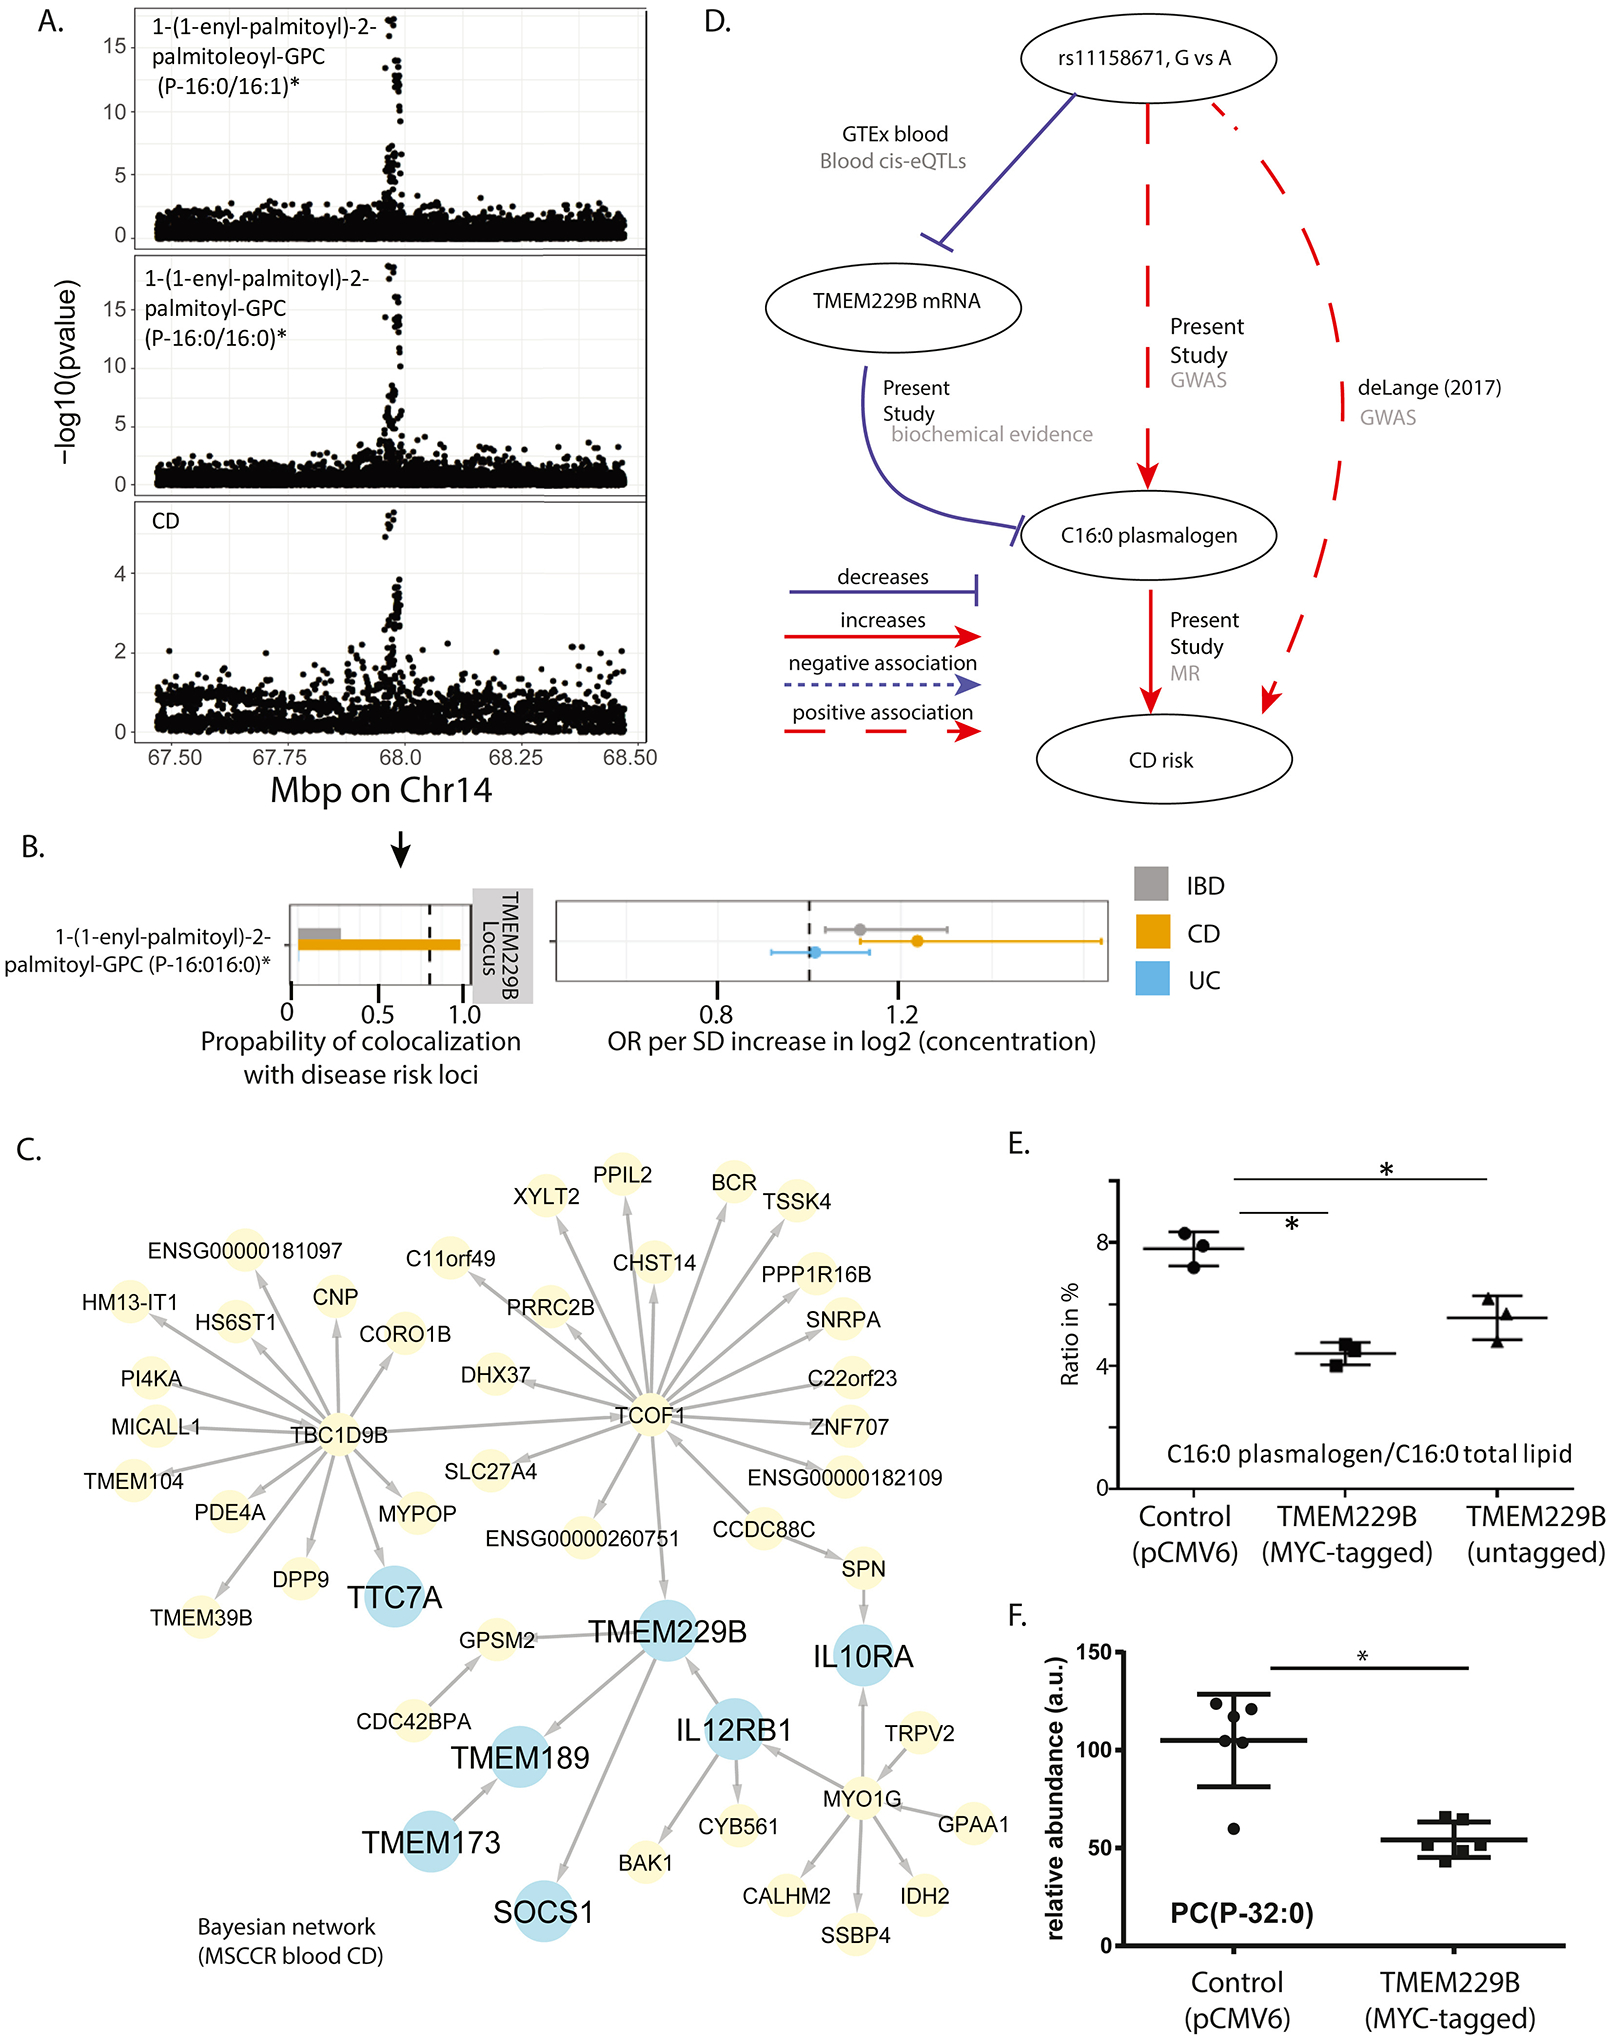
A) Regional association plots of genetic associations at the Chr14 position which contains TMEM229B, with CD risk and levels of serum C16:0 plasmalogen levels. Genome-wide significance threshold: 5E-8/1300=3.8E-11. B) Results of genetic colocalization and MR analysis between CD risk loci and the plasmalogen serum concentration on Chr14. Metabolites on the vertical axis, estimates on the horizontal axis, genetic regions in vertical stripes. See Figure 3 legend for details. C) Bayesian gene regulatory subnetwork built from the blood RNA sequencing data and genotype information on MSCCR CD patients. Arrows indicate predicted causal relationships between genes. Blue colored nodes indicate genes of interest used in discerning TMEM229B’s function or possible role in IBD pathology. Yellow nodes indicate genes belonging to the gene regulatory subnetwork. D) A summary of the evidence on the role of TMEM229B and the plasmalogen on CD risk. Solid lines represent putative causal associations; dashed lines represent statistical associations; edges are further labeled with their data source. E-F) MYC-tagged and non-tagged TMEM229B were overexpressed by transfection into HEK293 cells and cell pellets were collected and subjected to various lipid analyses (ST10). Plotted are the ratio of C16:0 in plasmalogen versus C16:0 in total lipid in E, and relative abundance of the plasmalogen PC(P-32:0) in F (*p<0.05).