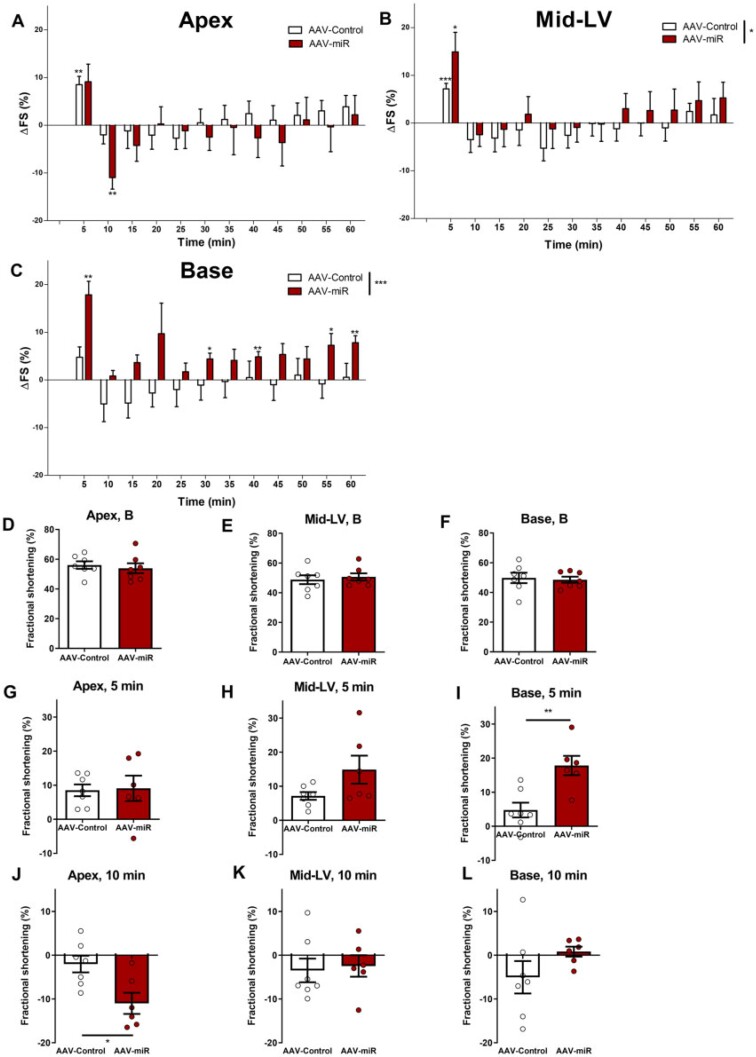
Figure 2.
AAV-miR produces TTS-like contractility in vivo following adrenaline. Six weeks after AAV-miR and AAV-control. Overall time-course are shown (A-apex, B-mid-LV, C-base). FS shown at baseline (D-apex, E-mid-LV, F-base), ΔFS at 5 min (G-apex, H-mid-LV, I-base), and ΔFS at 10 min post-adrenaline (J-apex, K-mid-LV, L-base). Mean ± SEM shown. For A–C and G–L, N = 7 for AAV-control and N = 6 for AAV-miR. For D–F, N = 7 throughout. Significance for A–C RM-ANOVA (displayed in figure key), and Student’s t-test comparing each timepoint to baseline and D–L by Student’s t-test. *P < 0.05, **P < 0.01, ***P < 0.001.

