Figure 3.
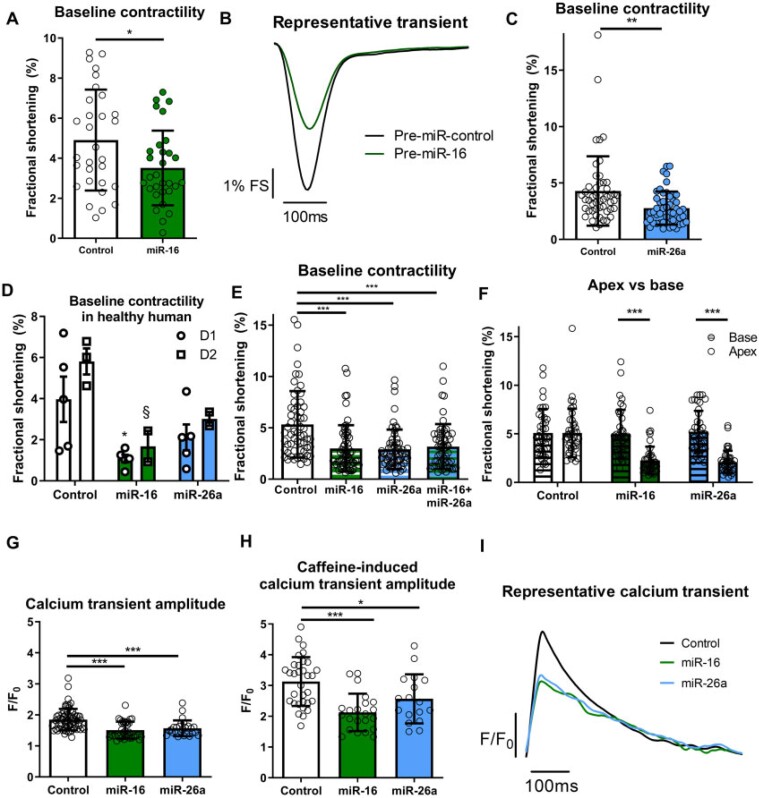
miRs reduce baseline contractility and calcium transient amplitude of apical cardiomyocytes. Adult rat apical cardiomyocytes FS shown with miR-16 [A, n/N = 30/6, representative contractile transient (B)] and miR-26a (C, n/N = 50/10). (D) Baseline FS of healthy human adult apical cardiomyocytes with TTS-miRs shown from donor 1 (D1, control = 5, miR-16 = 5, and miR-26a = 5, *P < 0.05 vs. control) and donor 2 (D2, control = 3, miR-16 = 2, and miR-26a = 2, §P < 0.05 vs. control) with one-way ANOVA for each heart separately. (E) Co-transfection of TTS-miRs (n/N = 60/6) in apical rat cardiomyocytes. (F) Paired apical/basal adult rat cardiomyocytes with TTS-miRs (n/N = 40/4). (G) Calcium transient amplitudes (control = 66/4, miR-16 = 37/4, and miR-26a = 26/4). (H) Caffeine-induced calcium transient amplitudes (control = 32/4, miR-26 = 22/4, and miR-26a = 17/4). (I) Representative calcium transient (Δamplitude over time). ‘n’ = cardiomyocytes and ‘N’ = rats. Mean ± SEM shown for D, Mean ± SD shown for A, C, E, F, H, and I. Significance was determined by Student’s t-test for B and C. For C, the cells in the control arm with 14% and 18% FS may be considered outliers, but exclusion did not affect the level of significance. For D, E, G, and H, significance was determined by one-way ANOVA with Tukey’s post-hoc and two-way ANOVA with Bonferroni post-hoc for F. *P < 0.05, **P < 0.01, ***P < 0.001.

