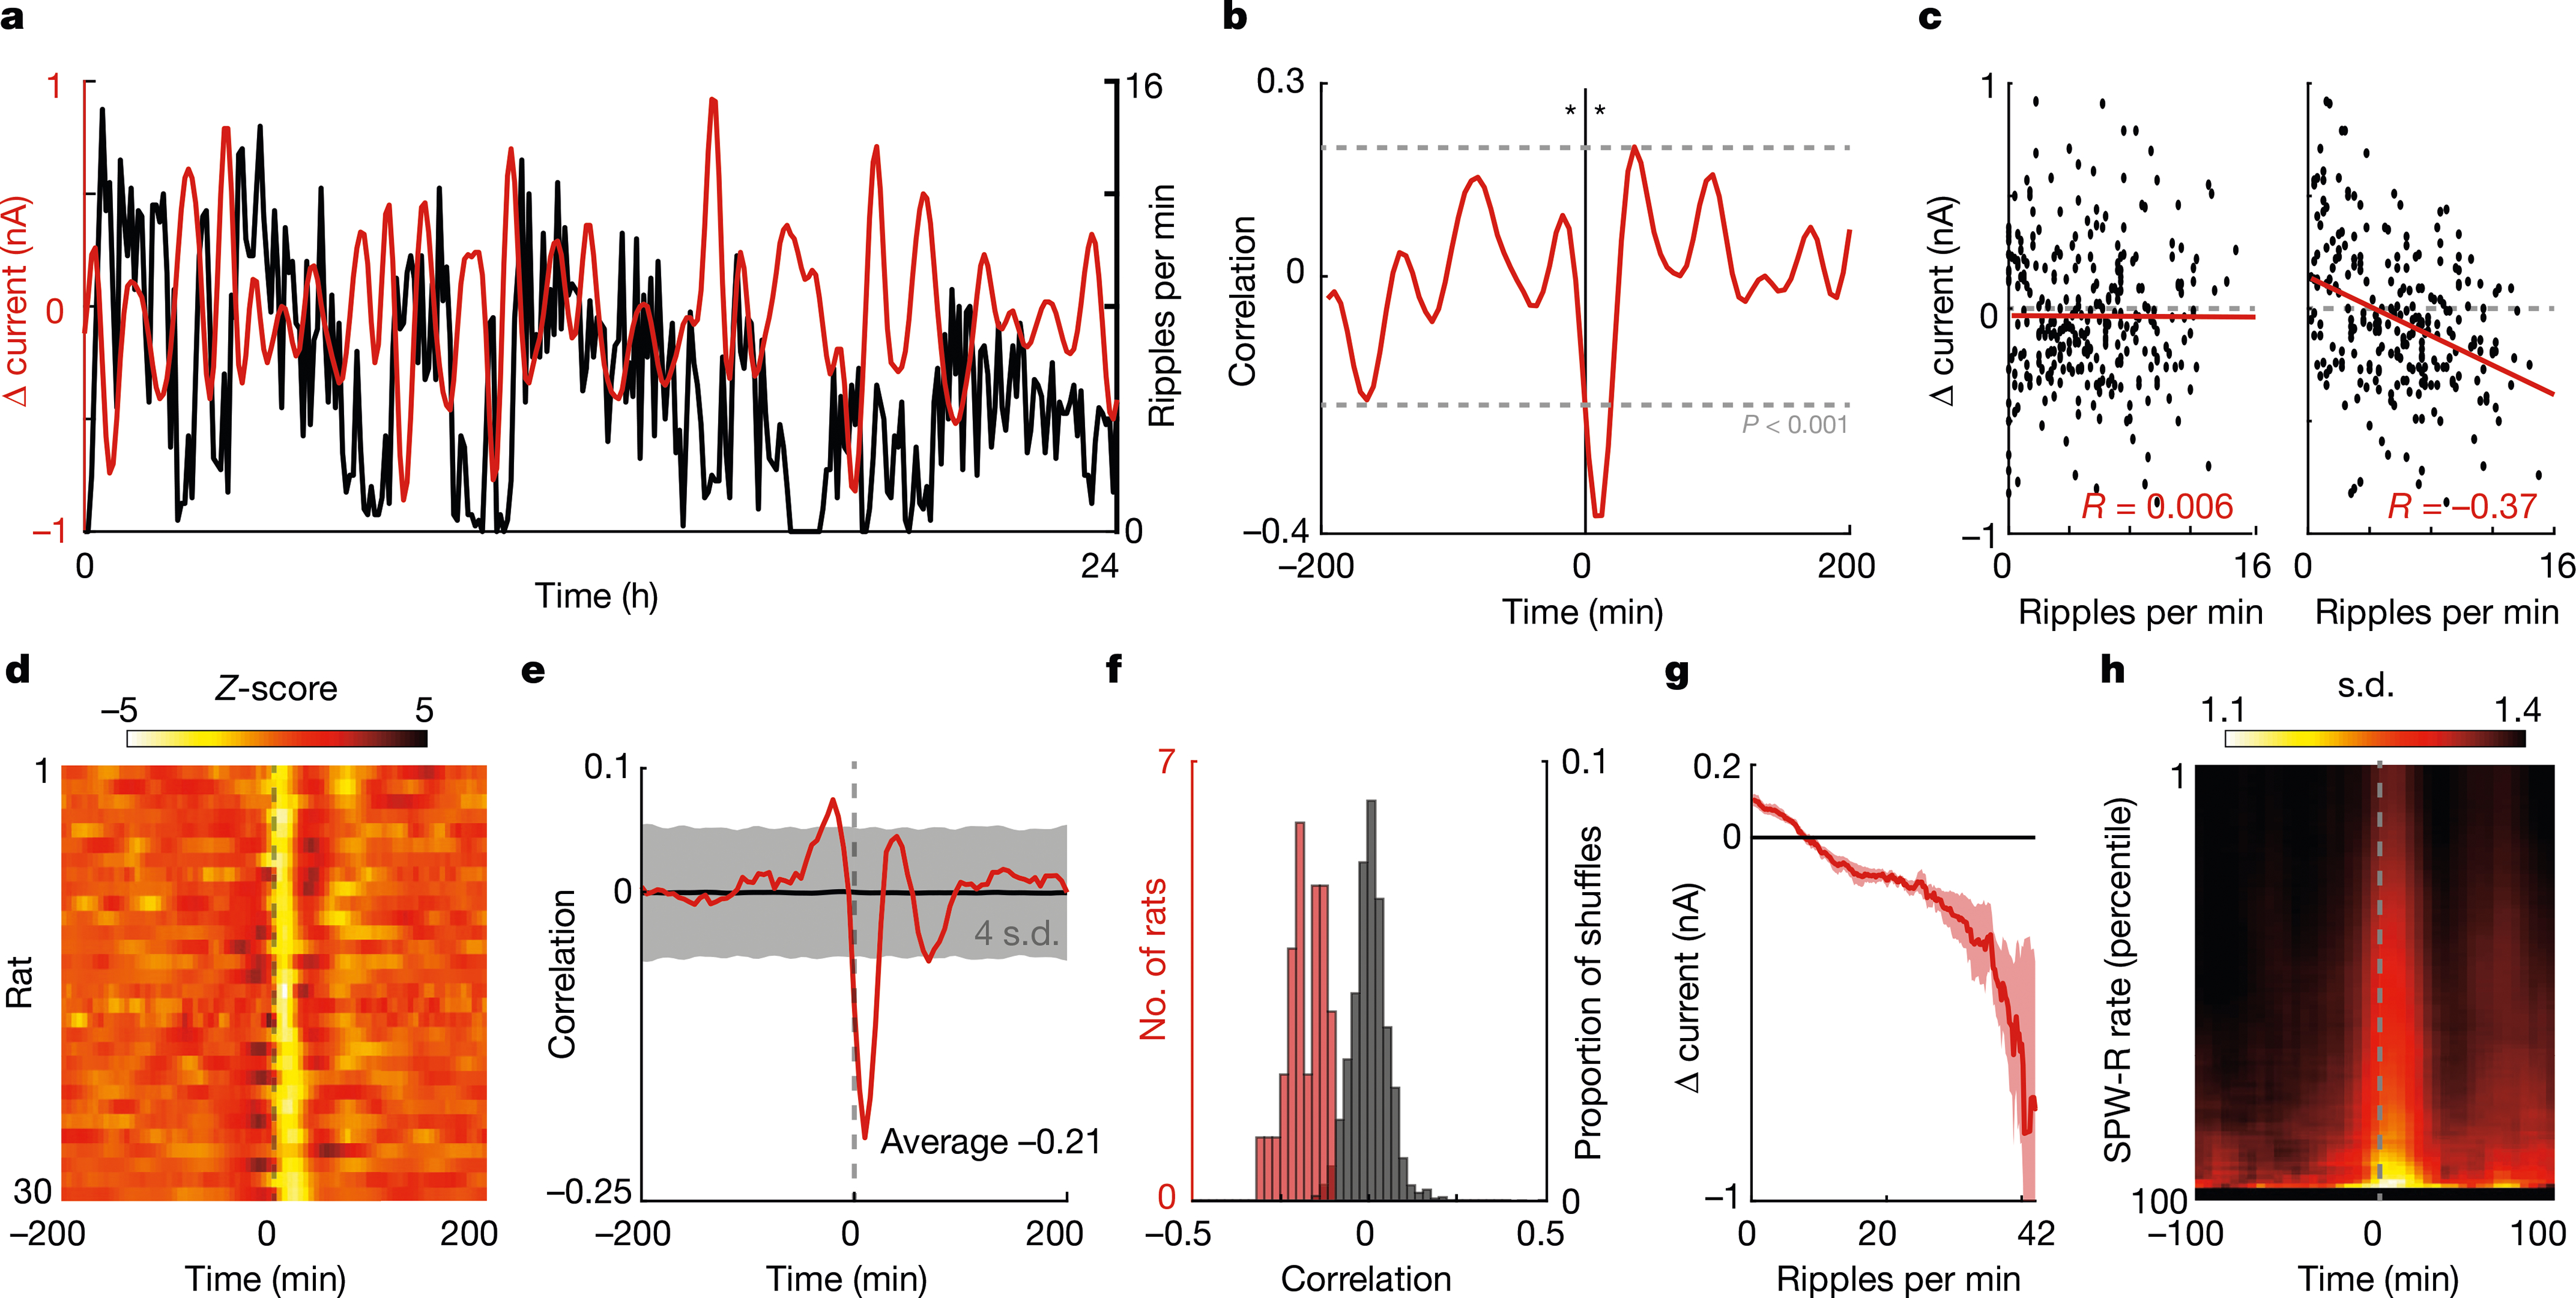
Fig. 2 |. SPW-R rate predicts future glucose fluctuations.

a, Example data from one 24-h period, for rat no. 7. Red trace is the derivative of the interstitial glucose concentration (shown as the change in current (Δ current)). Black trace is the rate of SPW-Rs per minute. b, Cross-correlogram for the data shown in a, centred on SPW-R rate. Asterisks indicate the 10-min offset time points shown in c. c, Scatter plots of the ripple rate and change in current with −10-min (left) and 10-min (right) lags. d, Summary cross-correlograms between SPW-R rate and change in current for all rats. e, Median cross-correlogram across rats (red) (n = 30) and median circularly shuffled cross-correlograms (black). f, Histograms of the correlation between SPW-R rate and current flux at 10 min (red) and the correlation observed when SPW-R rate is circularly permuted (black) (100 iterations per rat). g, Average change in current on the glucose monitor at 10-min time lag for 5-min epochs with different numbers of SPW-Rs. h, Heat map of the circular s.d. of glucose phase angles over time, triggered on peaks in the SPW-R rate.
