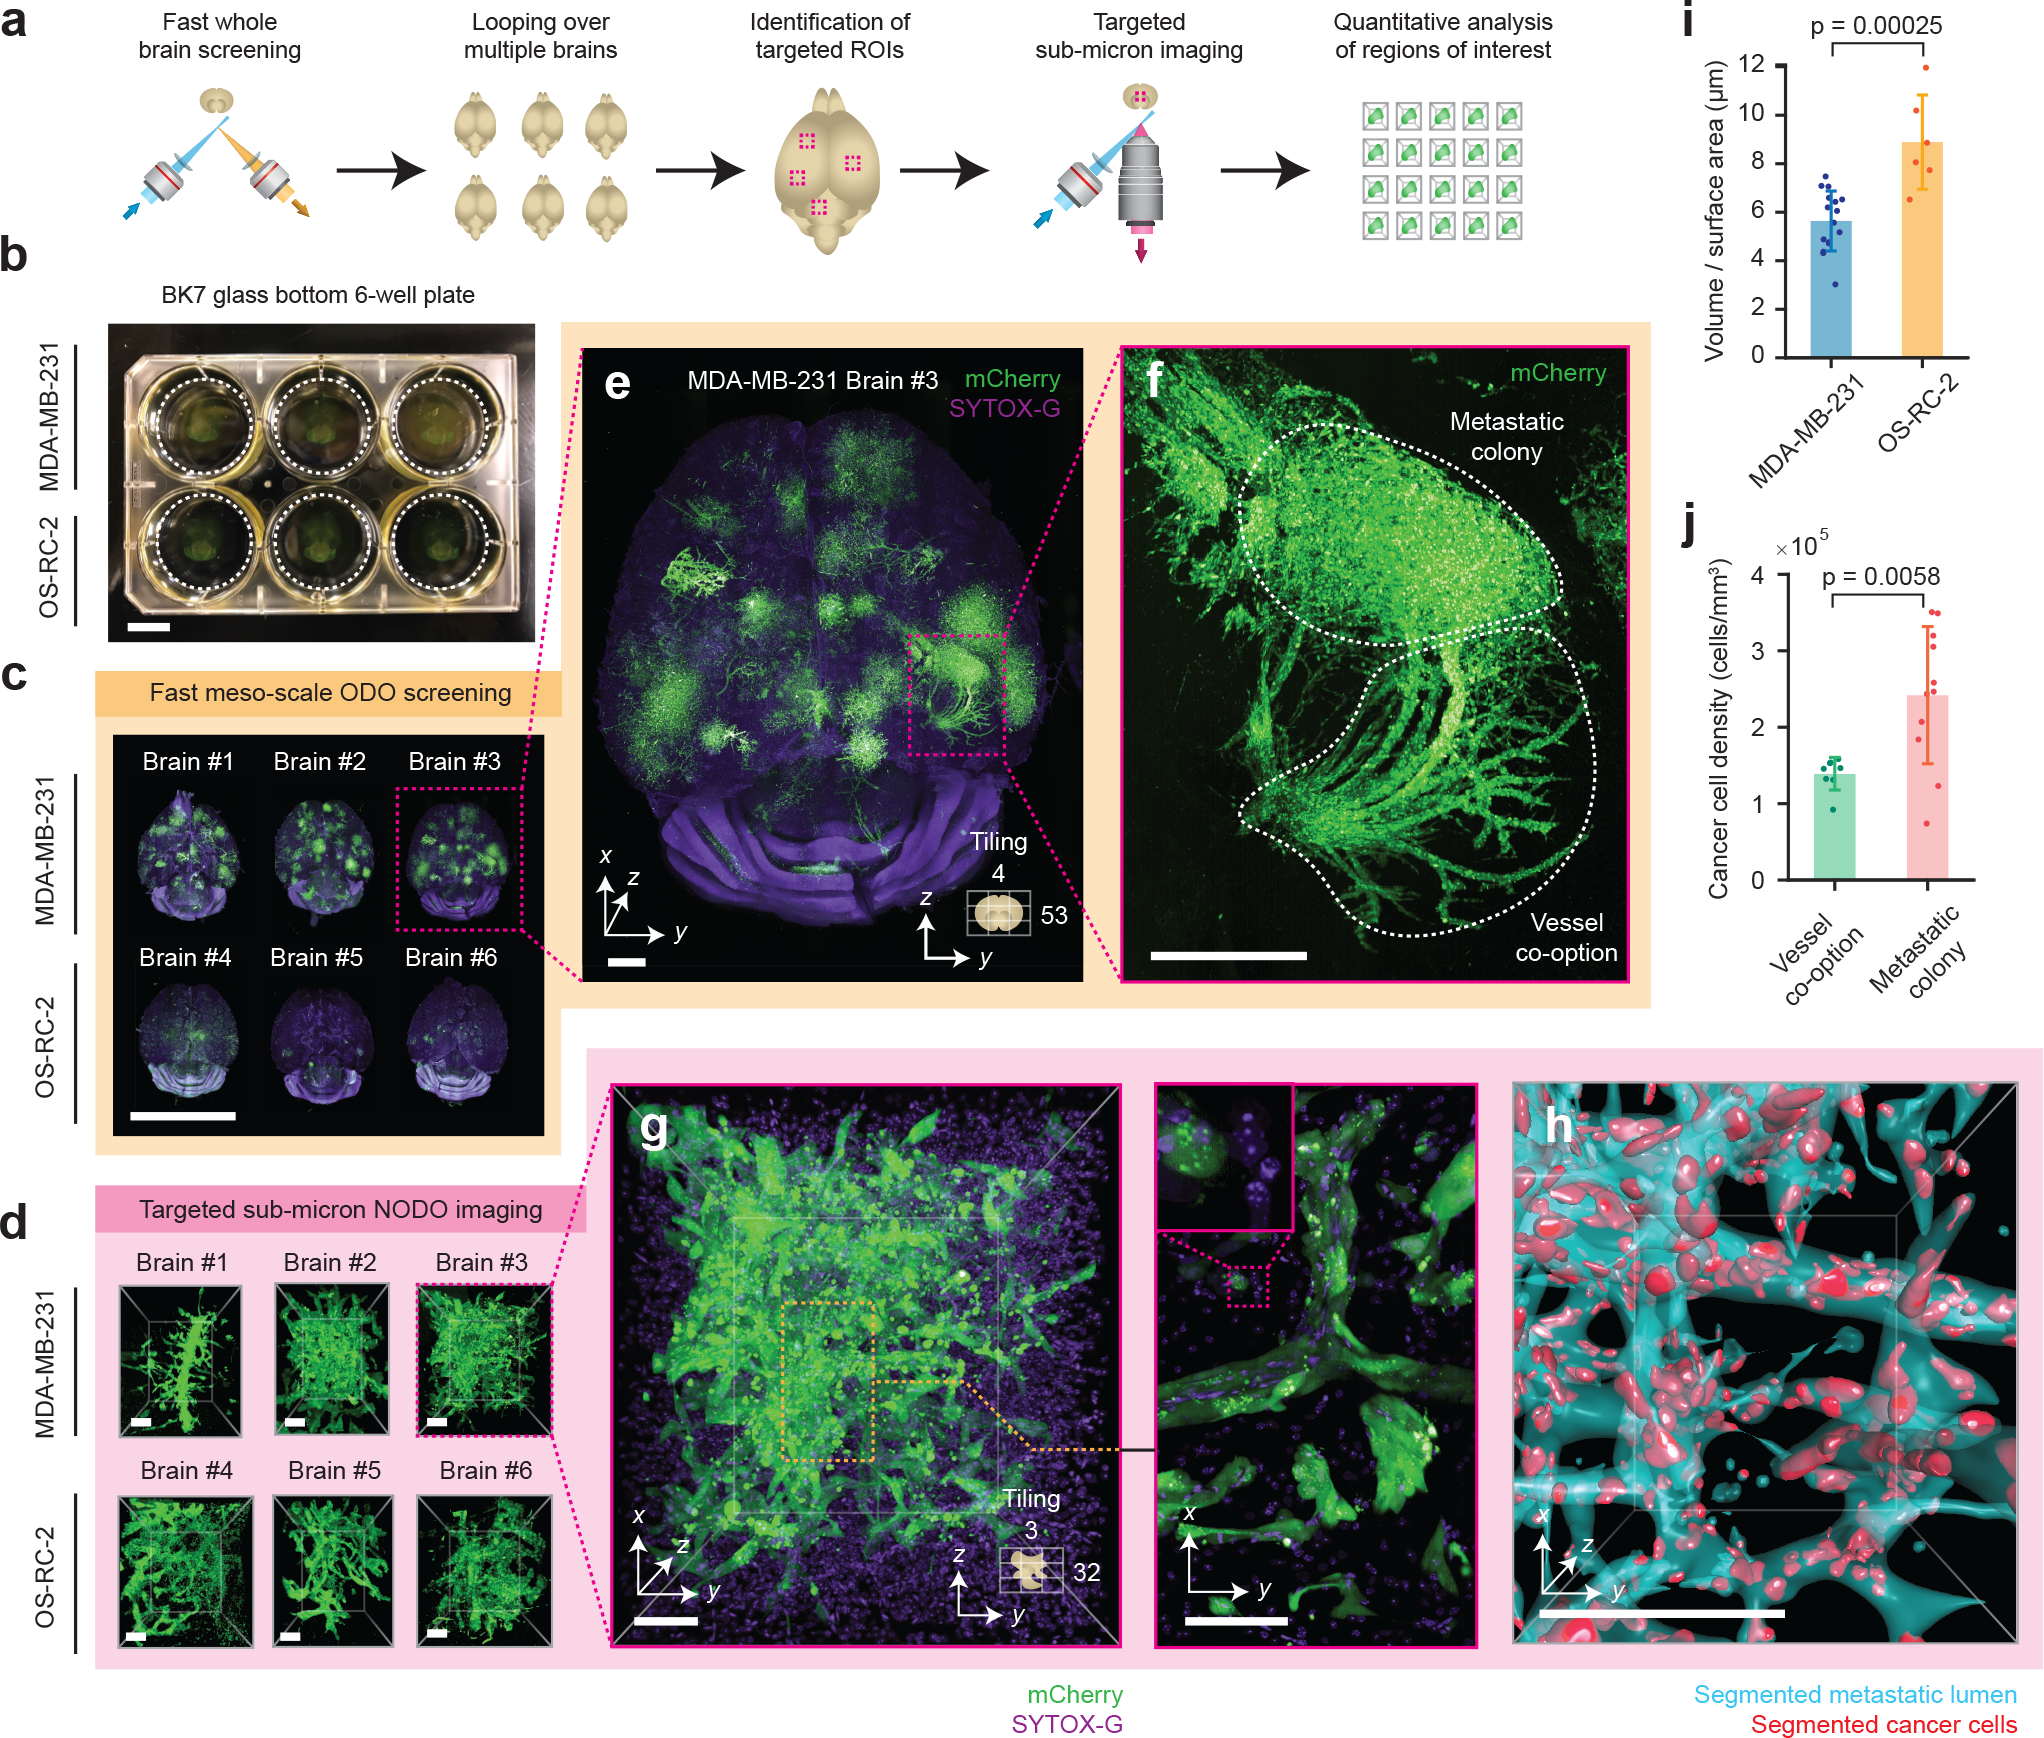
Figure 3 |. Multi-scale OTLS microscopy for quantitative analysis of brain metastases.

(a) Hybrid OTLS microscopy workflow for multi-scale imaging of multiple specimens. (b) n = 6 whole mouse brains containing metastatic lesions from two different cancer cell lines (MDA-MB-231 and OS-RC-2) were placed into a glass-bottom 6-well plate and mounted onto the hybrid OTLS microscope system for multi-scale imaging. (c) The ODO imaging path was used to rapidly screen multiple intact mouse brains containing metastatic colonies. (d) n = 34 total metastatic regions of interest (ROI) across all brains were identified and subsequently imaged at sub-micrometer resolution using the NODO imaging path (only one ROI per brain is shown for illustrative purposes). Visual inspection of a single brain with MDA-MB-231 metastases in (e) revealed multiple colonies distributed throughout the brain, with signs of vessel co-option (f-g) that were not observed for OS-RC-2 metastases. (h) To quantify these phenotypic differences between the MDA-MB-231 and OS-RC-2 metastases, the lumens spaces within the metastatic regions (cyan) and cancer cells (red) were computationally segmented and analyzed. (i) The volume to surface area ratio was computed for MDA-MB-231 ROIs (n = 16), and OS-RC-2 ROIs (n = 6). Quantification of the resulting segmentation masks revealed statistically different 3D growth patterns (p-value = 0.00025) between the two cancer cell lines, consistent with a previous report (i-j) [42]. (j) For MDA-MB-231 ROIs, the cancer cell density in ROIs of metastatic colonies (n = 11) and vessel co-option (n = 8) was found to be statistically different (p-value = 0.0058). The centerline and error bars in (i-j) denote the mean and standard deviation respectively, with the associated data points plotted. p-values in (i-j) were calculated using a two-sample t-test. Scale-bar lengths are as follows: (b-c) 1 cm, (d) 100 μm, (e) 1 mm, (f) 500 μm, and (g-h) 100 μm. All images are displayed without deconvolution. The imaging data in (c) was acquired from in a single experiment.
