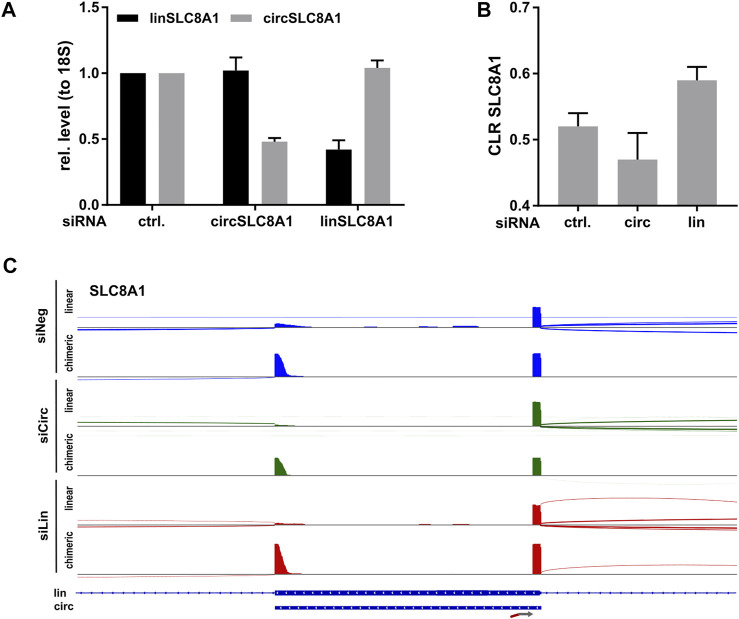
FIGURE 3.
Lexo-circSeq analysis of SLC8A1-depleted hiPSC-CM. hiPSC-CM was transfected with siRNAs targeting circSLC8A1, linSLC8A1 or a non-targeting siRNA (ctrl.) as control. Cells were analyzed 48 h post transfection (A) RT-qPCR analysis of linSLC8A1 and circSLC8A1. Data were normalized to 18S and the mean of the control samples. n = 2. (B) CLR for SLC8A1 from Lexo-circSeq analysis as indicated. n = 2. (C) Sashimi plot of the targeted region in SLC8A1. Linear reads are shown in the respective upper panels, chimeric reads in the lower panel. The different experimental conditions are indicated by color. The exon structure of the SLC8A1 mRNA and coordinates of the conserved circRNA are depicted below. All panels were scaled to a data range of 0-404 reads. The binding site of the FSS primer is indicated by an arrow.

