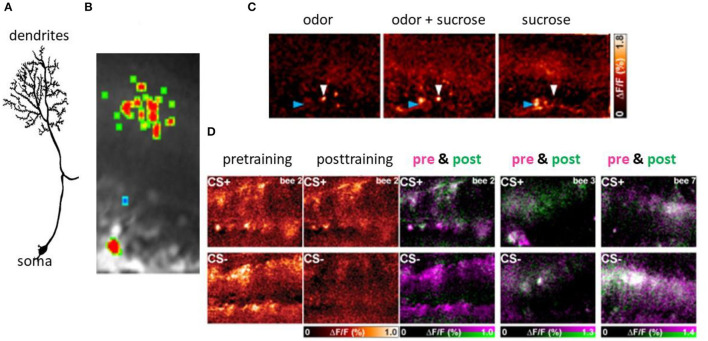
Figure 6.
Associative plasticity at the postsynaptic side of the KCs in the lip region of the MB. (A) A KC showing its spiny dendrites, the neurite and the soma. (B) The Ca imaging of the activity in the spines of a KC. (C) Sparse coding of odors in KCs both at the level of spines (blue arrow head) and the somata (white arrow heard). The bar on the right side gives the false color code from dark red (no Ca activity) to white (high Ca activity). (D) Changes of Ca activity during differential conditioning. The somata appear in the lower part of each picture, that of the dendrites in the upper part. The most left pair of figures shows the false color-coded Ca activity before conditioning for both CS+ and CS–, and the next pair the Ca activity after conditioning for the CS+ and the CS–. The Ca activity is expressed in the normalized change of Ca activity (ΔF/F ranging from zero to 1.0). The next three pictures show the learning effect in three animals separately for CS+ (upper pictures) and CS– (lower pictures). The Ca activity before conditioning is color-coded in pink and that after conditioning in green. The Ca activity only before conditioning will appear in pink indicating loss of activity, Ca activity only after conditioning will appear in green indicating a gain of activity. The Ca activity during both pre- and post-training phase will appear in white (no change) (Szyszka et al., 2008, see Figure 4A).

