. 2022 May 10;13(24):7126–7131. doi: 10.1039/d2sc01872a

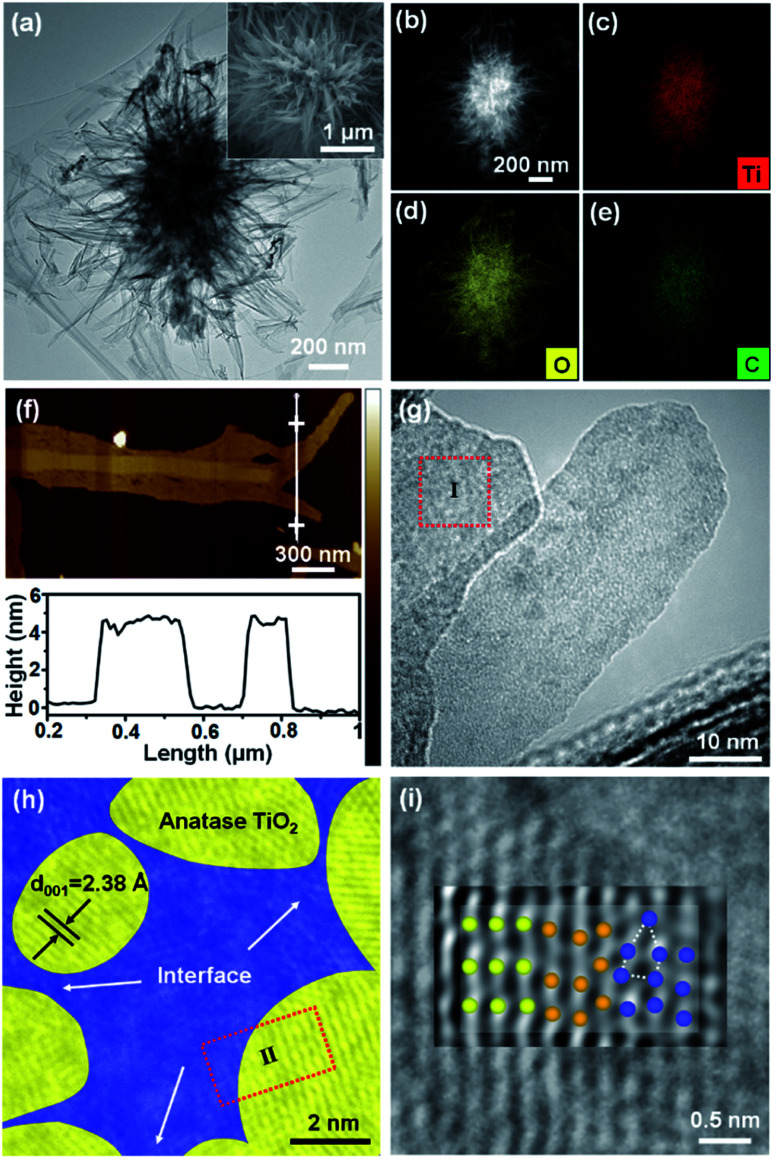
Fig. 1. (a) TEM image, inset: SEM image, (b) STEM image and the corresponding EDX mapping image of (c) Ti, (d) O, and (e) C elements, (f) AFM topography image and the corresponding height information of TiO2/CInter (g) TEM image, (h) magnified TEM image of region I and (i) original image and inverse FFT image of region II, and the corresponding atomic models of the highly crystalline phase (ordered lattice, light yellow, left), nanofusion phase (dark yellow, middle), and semi-crystalline/amorphous phase (disordered defects, blue, right) of TiO2/CInter. Fig. parts (h) and (i) are given in Fig. S7, ESI as originals without the interpreting color overlay.

Fig. 1