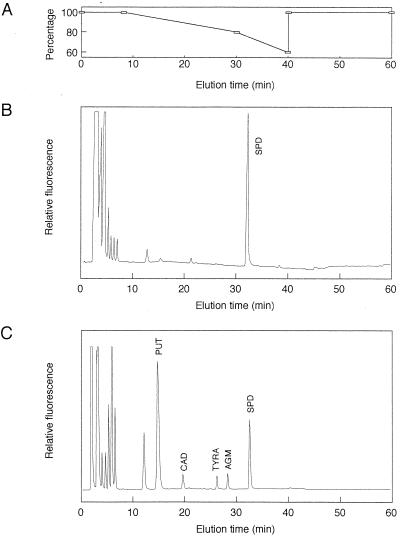
FIG. 1.
Analysis of polyamine composition by HPLC. (A) Elution from the reversed-phase column was done using a stepwise gradient with solvent A and solvent B. The gradient parameters are shown as percentages of solvent A. (B) Typical chromatogram of polyamines in Buchnera. (C) Typical chromatogram of polyamines in E. coli. PUT, putrescine; CAD, cadaverine; TYRA, tyramine; AGM, agmatine; SPD, spermidine.

