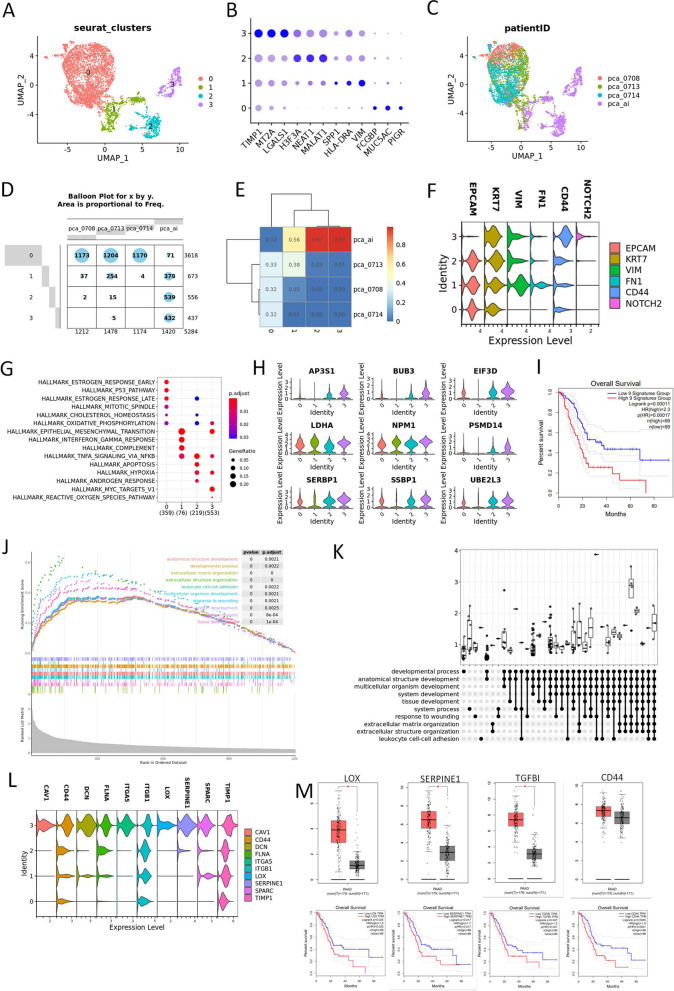
Fig. 3.
UCOGCP held distinct ductal profile. A, Major clusters of the ductal type I cells shown in UMAP. B, Top three markers of each cluster obtained from “FindAllMarkers” function from Seurat package (4.0.4) shown in dot plot. C-E, The distribution of each cluster in each sample shown in UMAP, balloon plot and heatmap, respectively. F, Violin plot showing markers of epithelial cells, cancer stem cells, and epithelial-mesenchymal transition (EMT) cells. G, Hallmarks among clusters shown in dot plot. H, Expression levels of enriched genes in HALLMAKS-MYC-TARGET-V1. I, Survival analysis of gene signatures in H in pancreatic cancer using TCGA-PAAD on website Gepia2 (http://gepia2.cancer-pku.cn/#index). J and K, GSEGO analysis of gene markers in cluster 2. L, Expression level of gene signatures enriched in at least eight of the top GSEGO clusters of cluster 3. M, Survival analysis of gene signatures in L in pancreatic cancer using TCGA-PAAD on website Gepia2 (http://gepia2.cancer-pku.cn/#index). N, Expression level and survival analysis of representative genes in L in pancreatic cancer using TCGA-PAAD on website Gepia (http://gepia.cancer-pku.cn/index.html)

