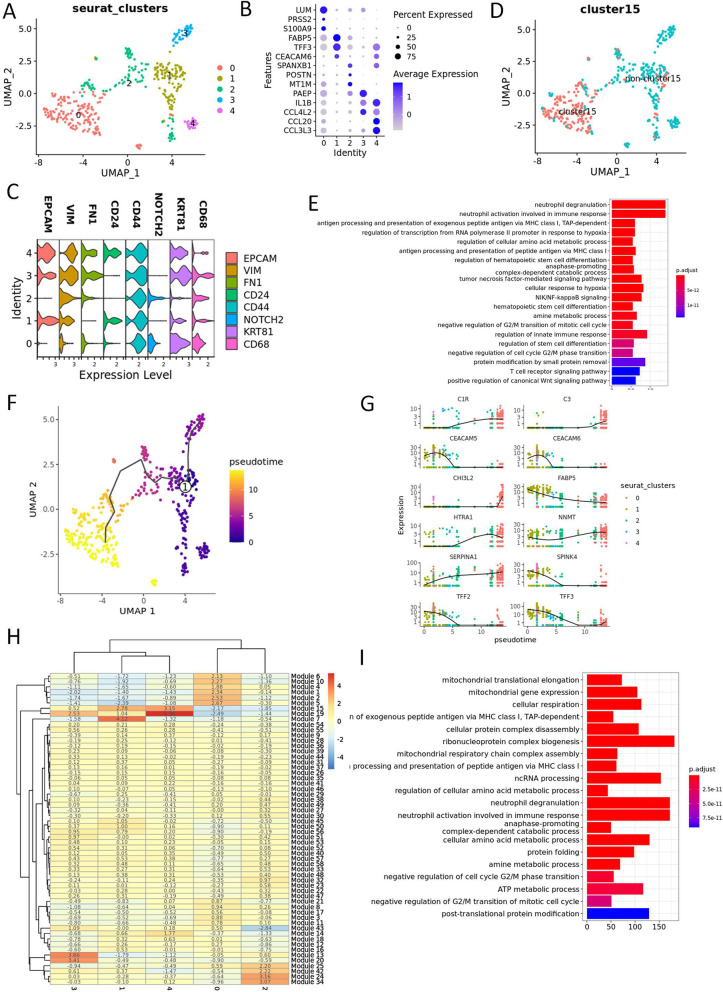
Fig. 4.
Trajectory analysis and function enrichment of the UCOGCP-specific EMT cells. A, Major clusters of the UCOGCP-specific EMT cells shown in UMAP. B, Top three markers of each cluster obtained from “FindAllMarkers” function from Seurat package (4.0.4) shown in dot plot. C, Expression pattern of interested gene markers. D, Mapping of cluster 15 in Fig. 2D. E, GO BP enrichment of cluster 0. F, Trajectory analysis by monocle 3. G, Top ten genes differentially expressed in different clusters. H, Heatmap showing gene modules co-expressed in different clusters. I, GO BP enrichment of gene modules closely related to cluster 0. Genes in module 1, 2, 5, 6, and 10 were used for GO BP enrichment

