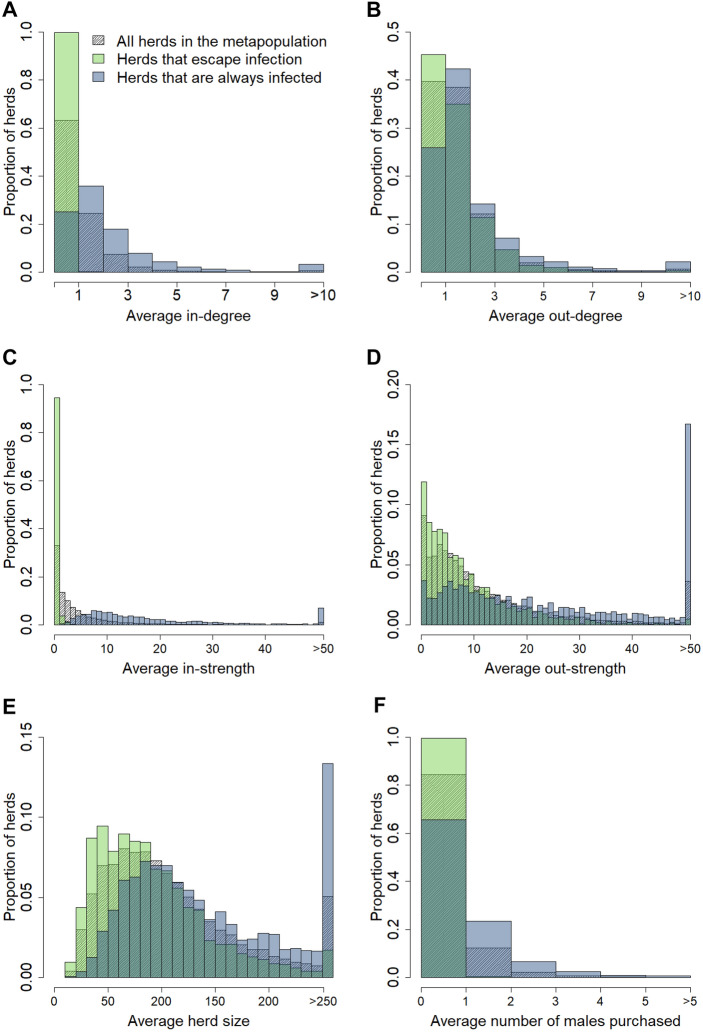
Figure 5.
Distribution of herd characteristics among all herds, those escaping infection, and those always infected. Herd characteristics of all herds in the metapopulation (n = 13 353, striped), herds that have a probability > 90% of escaping infection (1629 herds, green), and herds that consistently became infected during the 10-years simulation period (3862 herds, blue). Herd characteristics considered: average in-degree (A), average out-degree (B), average in-strength (C), average out-strength (D), average herd size (E), and average number of males purchased (F). For the definition of the probability of a herd escaping infection or becoming infected see text.

