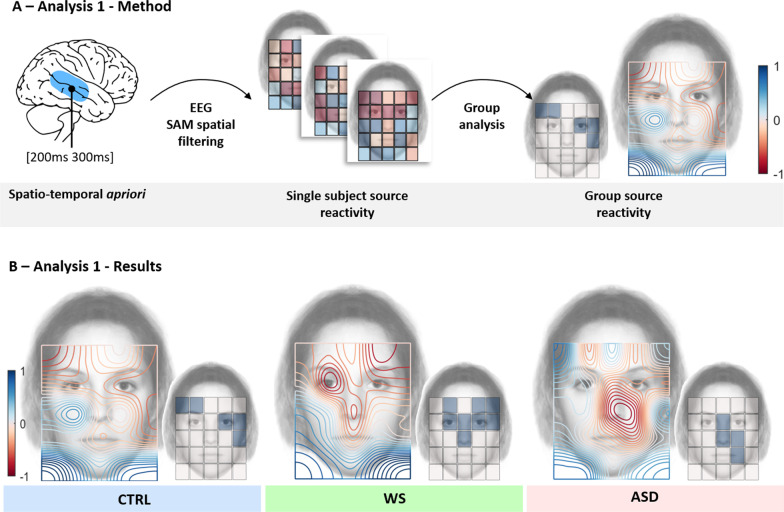
Fig. 2.
Method and results of the single trial evoked activity analysis. A Signal processing pipeline of this analysis 1. First, a spatial-filter was built to extract single-trial activity evoked between 200 and 300 ms in the superior temporal region at the single subject and group-level. B Results of evoked activity mapped over a face area for the neurotypical participants (CTRL, in blue, on the left), patients with Williams-Beuren syndrome (WS, in green, in the middle); and patients with autistic spectrum disorders (ASD, in red, on the right). For each group, the large face on the left (with a Red-Blue color scheme) shows a contour plot of interpolated results of the degree of evoked activity in the STS measured as a function of the face region attended to by participants. The small face on the right (with blue tiles) shows tiles which represent maximum and significant (p < 0.05 FWER corrected) areas of evoked activity. Activity in young neurotypicals confirms that activity was eye-sensitive (significant on the left eye), as found previously in adults (Lio et al. [38] Exp. 2). This was maximal in the upper part of the face, over the eyes and eyebrows, and decreased to reach a local minimum in the left and right lower corners, outside the face area. WS patients showed a similar activation map with significant activity over the eyes, eyebrows and nose region. ASD showed an atypical pattern with significant activity on the nose region and cheek

