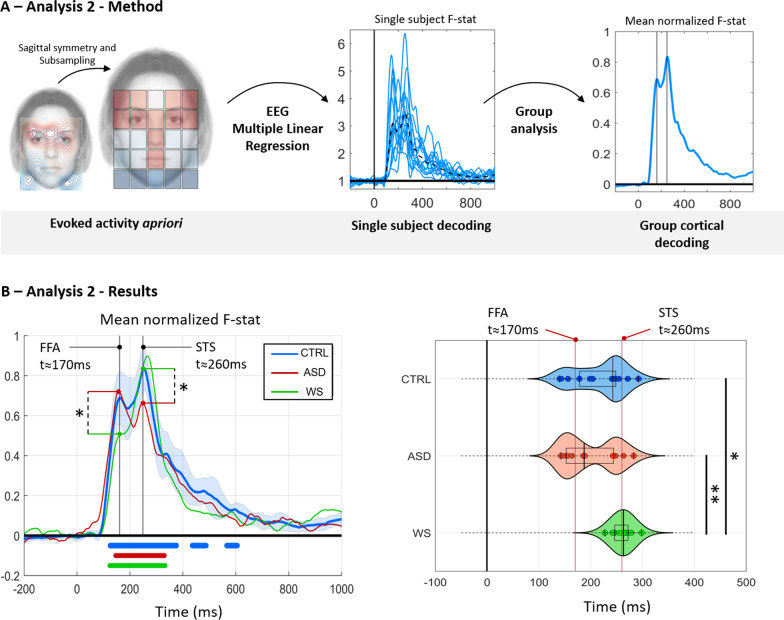
Fig. 3.
Prediction of evoked activity with face cue map spatial regressor. A Signal processing pipeline for the second analysis. The ‘socially relevant face cue map’ regressor was generated from the neurotypical evoked activity (applying a sagittal symmetry and subsampling) (left part). Then, a multiple linear regression is applied and the Fischer-Snedecor F statistic denoting the quality of decoding obtained at each time point between 0 and 1000 ms is generated for each subject (see dotted lines, on the middle graph). Finally, each decoding signal (Fisher-Snedecor F statistic) scaled between zero (min) and one (max) for each subject was averaged for the group analysis (right graph). B Results from decoding the facial-cue map for the neurotypical participants (CTRL, in blue), patients with Williams-Beuren syndrome (WS, in green) and patients with autistic spectrum disorders (ASD, in red). On the left graph, mean normalized F score for the decoding of each group as a function of time. Significant Fisher-Snedecor F values at the group-level are underlined in blue, green and red for neurotypical, patients with WS and Patients with ASD respectively. At the group level, the neurotypical decoding curve (blue) presents two marked peaks, one at 170 ms post stimulus onset, the second at 260 ms post stimulus onset. The ASD population (red curve) produced a significantly higher decoding peak than the WS population (green curve) at the earlier timing (170 ms–p < 0.05 FWER corrected). A reversed pattern was found at the latter decoding peak (260 ms post-stimulus onset, WS > ASD p < 0.05 FWER corrected). On the right graph, the distribution of the timing of the maximum peak for each individual in each group is plotted over time. The distribution in the neurotypical population (blue) and in patients with ASD (red) is bimodal with a dominance at 260 ms for neurotypical participants and at 170 ms for patients with ASD. The distribution in WS patients is strictly unimodal

