
Fig. 3. sPRR-His directly interacts with the AT1R.
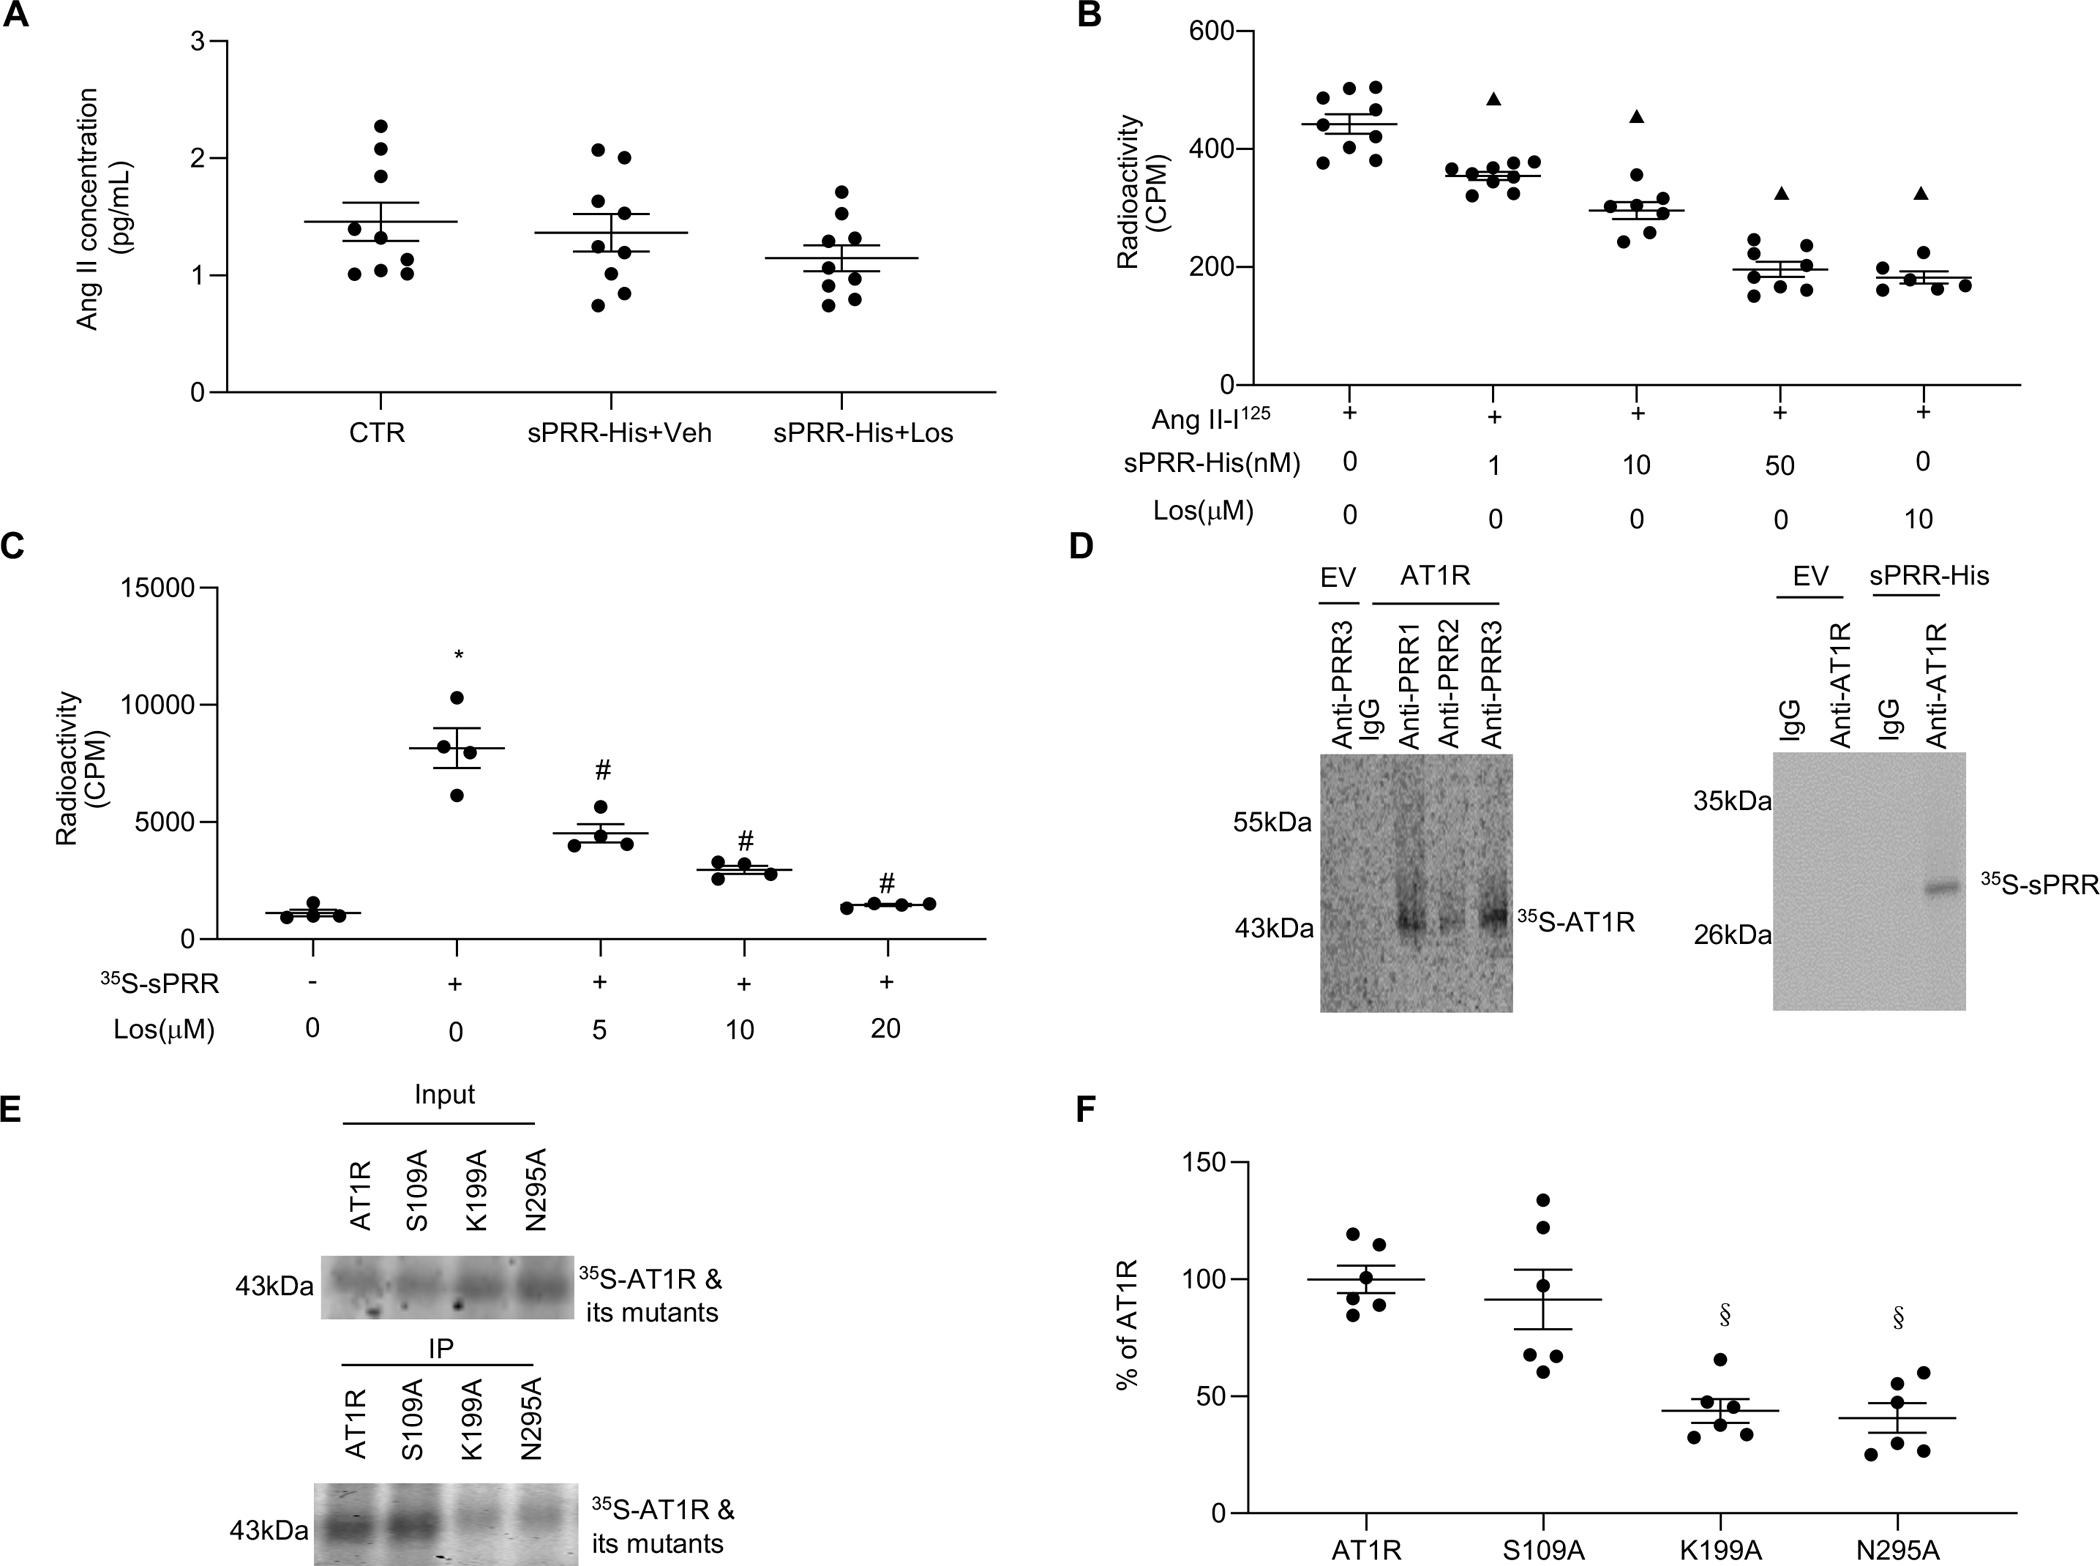
(A) Effect of 10μM Los on protein levels of Ang II in the medium of HUVECs after 50nM sPRR-His treatment. (B) HUVECs were pretreated with 1nM, 10nM, 50nM sPRR-His or 10μM Los for 1h followed by exposure to 1μM Ang II-I125. A radioactive ligand competitive binding assay then was performed. (C) HUVECs were incubated with 35S-labeled sPRR (35S-sPRR) overnight after one-hour pretreatment with Los at different dosages. A radioactive ligand competitive binding assay then was performed. The radioactive counts per minute (CPM) were measured in each group. (D) In vitro protein-protein interactions between AT1R and sPRR-His were detected. The AT1R or sPRR-His was labeled with 35S-methionine during in vitro translation. The commercial sPRR-His or AT1R proteins and its respective antibodies were added to immunoprecipitate the 35S-labeled proteins. EV: empty vector control; Anti-PRR1: PRR antibody (Sigma); Anti-PRR2: antibody against mouse PRR AA 32–45; Anti-PRR3: antibody against mouse PRR AA 219–235. (E) In vitro protein-protein interactions between sPRR-His and 35S-AT1R or 35S-AT1R site-mutations were detected. The immunoprecipitation experiment with anti-PRR antibody following incubation of sPRR-His and 35S-AT1R or its mutants was performed. The quantitative analysis is shown in (F). S109A: 35S-AT1R site-mutation in Serine109; K199A: 35S-AT1R site-mutation in Lysine199; N295A: 35S-AT1R site-mutation in Aspargine295. N=6–9. Statistical analysis was performed by using one-way ANOVA with the Bonferroni test for multiple comparisons or by using unpaired Student’s t test for two comparisons. ▲P < 0.01, compared with the Ang II-I125; *P < 0.01, compared with the CTR; #P < 0.01, compared with the 35S-sPRR; §P < 0.01, compared with the AT1R group. Data are mean ± SEM.