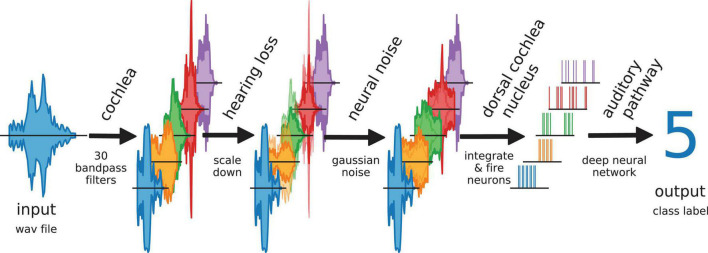
FIGURE 2.
Data flow in auditory pathway model. The scheme shows how the speech data is processed within the model. The cochlea splits the signal via 30 bandpass filters. The bandpass filtered data is scaled down to simulate a hearing loss. The hearing loss affects only channels within the speech relevant frequency range (orange, green, red). The other frequency channels are unchanged. Neural noise is added to investigate the effect of stochastic resonance (only in hearing impaired channels). The DCN is simulated as 30 LIF neurons. Each LIF neuron represents a complete biological neuron population. The spike data is down-sampled and fed to the deep neural network.

