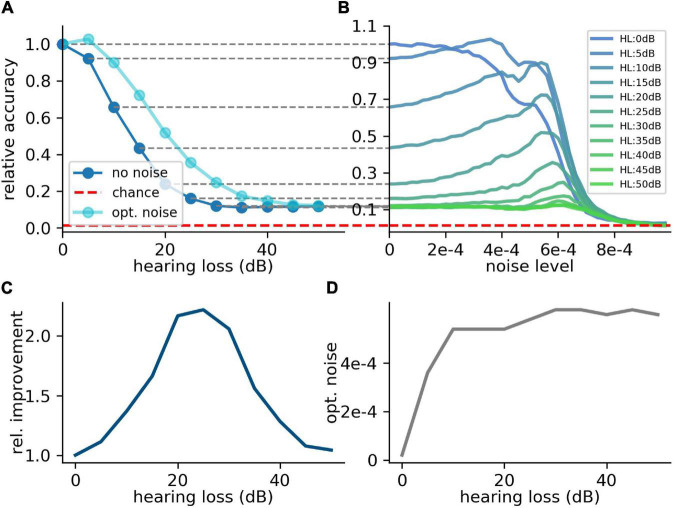
FIGURE 7.
Effect of SR on speech recognition. (A) The curve shows the relative accuracy of the trained neural network as a function of the hearing loss (red dashed line: chance level; ). The hearing loss (5–50 dB, 5 dB steps, frequency range of HL: 400 Hz–4,000 Hz) was implemented in the test data set and propagated through the pre-trained network. Thus, the cochlea output was multiplied with an attenuation factor (). This output was then transformed using the integrate-and-fire neurons and fed in the neural network. (B) Relative accuracy as a function of the applied noise level for different hearing losses. Resonance curves with one global maximum at a certain noise level > 0 could be shown. (C) Best relative improvement as a function of the hearing loss. (D) Optimal noise level as a function of the hearing loss.

