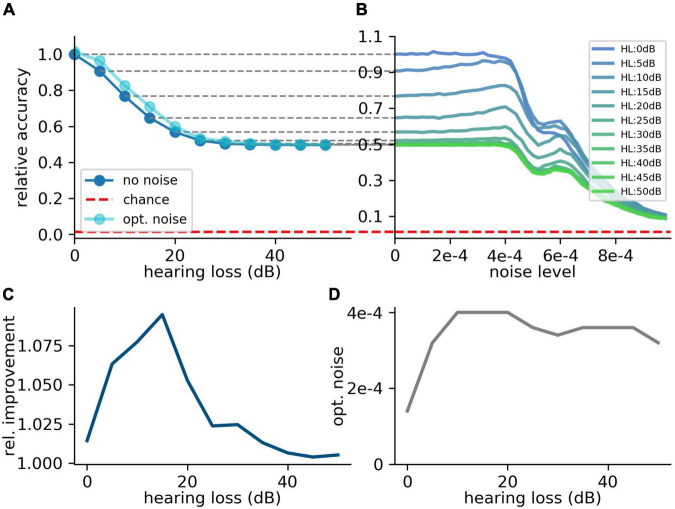
FIGURE 8.
Effect of SR on speech recognition (high frequency hearing loss). Same analysis as shown in Figure 7 for high frequency hearing loss. (A) The plots show the relative accuracy of the trained neural network as a function of the hearing loss (red dashed line: chance level). The high frequency hearing loss lead to different effects (10–50 dB, 10 dB steps, frequency range of HL: above 4,000 Hz). (B) The relative accuracy as a function of the noise has no clear maximum above the value for no added noise (nearly no SR). Furthermore, a second local maximum occurs. (C) The best relative improvement does not significantly increase over 10%. (D) Optimal noise level as a function of hearing loss shows similar behavior as for the hearing loss in the speech relevant frequency range (cf. Figure 7).

