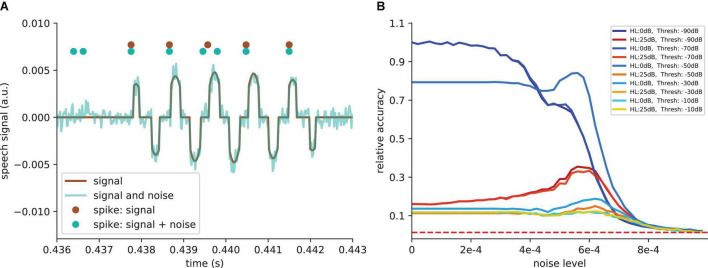
FIGURE 9.
SR effect with additional threshold. (A) Example of signal after simulated cochlea for one frequency channel and an additional threshold of −50 dB (−50 dB means that all values above and below ≈ 0.003 are set to zero). This threshold is introduced to show that the SR effect also works when hearing loss leads to a real information loss. The noise leads to a signal enhancement (cyan curve). Thus, the signal causes more spiking in the DCN (cyan dots compared to brown dots). (B) Relative accuracy as a function of the amplitude of the added noise. SR resonance partly restores the accuracy. For very high thresholds, where main parts of the signals are deleted, the SR does not restore the accuracy.

